Rivastigmine Transdermal System Patch, Extended Release
Product Images NDC 72162-1608

View Photos of Packaging, Regulatory Labels, and Product Appearance

Product Visual Gallery

This gallery contains 18 technical images submitted to the FDA as part of the official labeling for Rivastigmine Transdermal System (NDC 72162-1608). Unlike standard consumer photos, these assets often include clinical data figures, molecular chemical structures, and official manufacturer packaging layouts.

As provided by Bryant Ranch Prepack, these visuals offer a comprehensive scientific overview of the product's physical and chemical identity, aiding pharmacists and researchers in product verification and study.

FDA Label Image

Label (Lbl721621608)

Label (Lbl721621608)
Label for Rivastigmine Transdermal System 4.6 mg/24 hours patch, showing dosage strength and instructions to wear one patch daily. The label includes storage instructions, warnings, and manufacturer information including Bryant Ranch Prepack as the relabeler and AdhexPharma as the manufacturer. The package contains 30 systems and is marked Rx only.*
FDA Label Image

Chemical Structure (Rivastigmine 01)

Chemical Structure (Rivastigmine 01)
Chemical structure of Rivastigmine, depicting its molecular bonds and arrangement including nitrogen, oxygen, and methyl groups attached to a phenyl ring.*
FDA Label Image

Figure 1 (Rivastigmine 02)

Figure 1 (Rivastigmine 02)
An illustration showing a cross-sectional diagram of a multilayer transdermal patch labeled as Rivastigmine Transdermal System 4.6 mg/24h. The diagram identifies four discrete layers of the patch and highlights two dimple features on the patch surface for application or manufacturing reference.*
FDA Label Image

Figure 2 (Rivastigmine 03)

Figure 2 (Rivastigmine 03)
A line graph showing rivastigmine plasma concentration (ng/mL) over 24 hours for three dosage strengths: 13.3 mg/24 hours, 9.5 mg/24 hours, and 4.6 mg/24 hours. The graph includes error bars and sample sizes for each group, illustrating drug levels peaking within the first 8 hours and declining thereafter.*
FDA Label Image

Figure 3 (Rivastigmine 04)

Figure 3 (Rivastigmine 04)
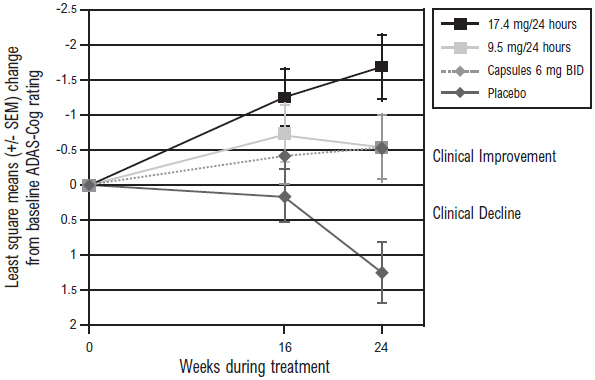
A line graph depicting least square mean changes in ADAS-cog ratings from baseline over 24 weeks of treatment with Rivastigmine in different dosages (17.4 mg/24h and 9.5 mg/24h), capsules 6 mg BID, and placebo. The graph shows clinical improvement and decline zones on the vertical axis and includes error bars for standard error measurements.*
FDA Label Image

Figure 4 (Rivastigmine 05)

Figure 4 (Rivastigmine 05)
Bar chart depicting the percentage of patients by ADCS-CGIC rating categories, comparing four groups: 17.4 mg/24 hours Rivastigmine patch, 9.5 mg/24 hours Rivastigmine patch, 6 mg capsules BID, and placebo. Categories range from markedly improved to markedly worse, with highest percentages observed in the no change and minimal improvement ratings.*
FDA Label Image

Figure 5 (Rivastigmine 06)

Figure 5 (Rivastigmine 06)
A line chart showing ADCS-IADL change from baseline over 48 weeks of treatment comparing two doses of Rivastigmine Transdermal System (13.3 mg/24hr and 9.5 mg/24hr). The x-axis represents weeks of treatment, and the y-axis indicates clinical improvement or decline. The graph shows greater clinical decline at the lower dose.*
FDA Label Image

Figure 6 (Rivastigmine 07)

Figure 6 (Rivastigmine 07)
Line graph depicting ADAS-Cog change from baseline (least squares means and SEM) over 48 weeks of treatment for Rivastigmine Transdermal System at two doses, 13.3 mg/24hr and 9.5 mg/24hr. The vertical axis indicates clinical improvement or decline, and the horizontal axis shows treatment duration in weeks. The higher dose shows less cognitive decline over time compared to the lower dose.*
FDA Label Image

Figure 7 (Rivastigmine 08)

Figure 7 (Rivastigmine 08)
A line graph comparing least squares mean change ± standard error over 24 weeks of treatment between Rivastigmine Transdermal System 15 cm² and 5 cm². The vertical axis measures LS mean change from -8 to 3, with labels for clinical improvement and decline. The horizontal axis shows weeks of treatment at 0, 8, 16, and 24. The 15 cm² group shows mostly stable values near zero, while the 5 cm² group shows a decrease over time. Statistical significance is noted at weeks 16 and 24 for the 5 cm² group.*
FDA Label Image

Figure 8 (Rivastigmine 09)

Figure 8 (Rivastigmine 09)
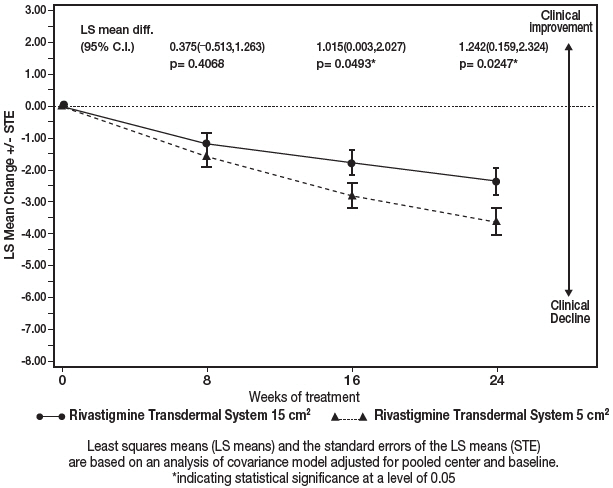
A line graph comparing the least squares mean change with standard errors over 24 weeks of treatment for Rivastigmine Transdermal System 15 cm² and 5 cm². The y-axis shows the LS mean change with standard errors, ranging from clinical improvement to clinical decline, and the x-axis represents the weeks of treatment (0, 8, 16, 24). Data points include LS mean differences with p-values and confidence intervals for each time point.*
FDA Label Image

Figure A (Rivastigmine 10)

Figure A (Rivastigmine 10)
An instructional diagram illustrating the Rivastigmine Transdermal System. It shows the pouch packaging, the patch with protective liners on both sides labeled with Rivastigmine, and a detailed view of the patch components including the adhesive containing the medicine and the outside backing.*
FDA Label Image

Figure B (Rivastigmine 11)

Figure B (Rivastigmine 11)
An instructional diagram showing recommended application sites for the Rivastigmine Transdermal System 4.6 mg/24h patch. Possible locations include the left or right upper arm (side), left or right side of chest (front), left or right upper back (back), and left or right lower back (back). Each application area is marked with a shaded rectangle.*
FDA Label Image

Figure C (Rivastigmine 12)

Figure C (Rivastigmine 12)
An illustration showing a hand holding a Rivastigmine Transdermal System pouch, with scissors positioned to cut the pouch open, indicating how to open the packaging for the transdermal patch.*
FDA Label Image

Figure D (Rivastigmine 13)

Figure D (Rivastigmine 13)
An instructional illustration showing hands peeling protective liners from the sticky surface of a Rivastigmine Transdermal System patch. The diagram highlights the removal of the protective liners before applying the transdermal patch to the skin.*
FDA Label Image

Figure E (Rivastigmine 14)

Figure E (Rivastigmine 14)
An instructional illustration showing the application of the Rivastigmine Transdermal System patch on the upper back of a person. One hand is pressing the patch onto the skin while the other hand holds it in place, demonstrating correct transdermal patch placement technique.*
FDA Label Image

Figure F (Rivastigmine 15)

Figure F (Rivastigmine 15)
An instructional illustration showing a hand applying a patch to the upper back area, demonstrating the application site for a transdermal system patch on the skin.*
FDA Label Image

Figure G (Rivastigmine 16)

Figure G (Rivastigmine 16)
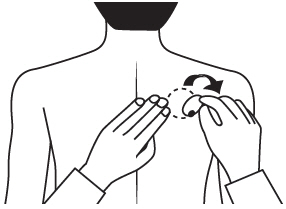
An instructional line drawing showing a person applying a Rivastigmine transdermal patch to the upper chest area, illustrating the proper placement of the patch on the skin.*
FDA Label Image

Figure H (Rivastigmine 17)

Figure H (Rivastigmine 17)
An instructional illustration showing the disposal procedure for a Rivastigmine Transdermal System patch. The sequence includes folding the sticky sides of the patch together, placing the folded patch into its original empty pouch, and then discarding the pouch into a trash bin, with a reminder to keep the waste away from children and pets.*

* About these descriptions: Image descriptions on this page are generated by automated AI analysis of the product label images from the manufacturer's FDA label submission (SPL). They are provided for reference only and may contain errors or omissions. Always rely on the printed label itself and the official FDA labeling, and consult a pharmacist or healthcare professional with any questions about this product.