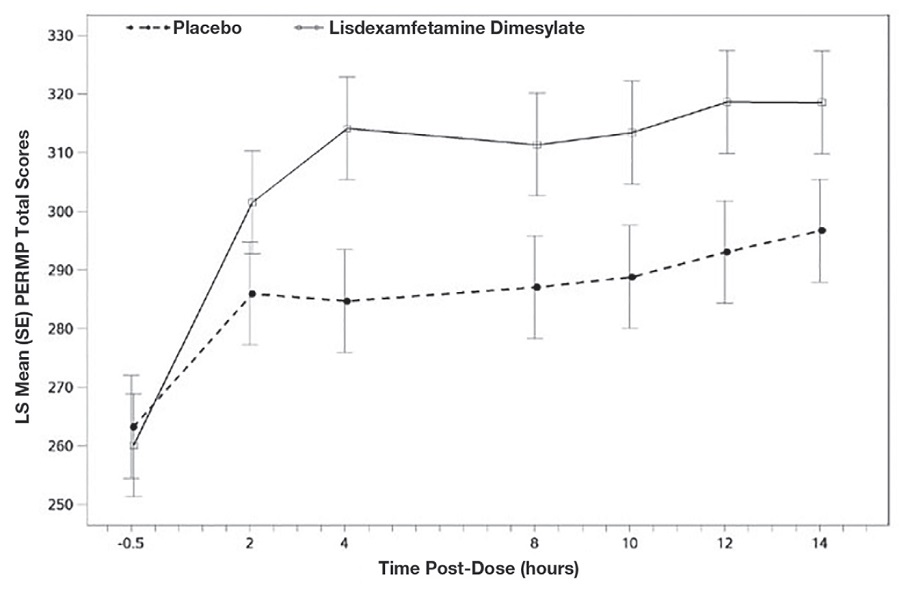
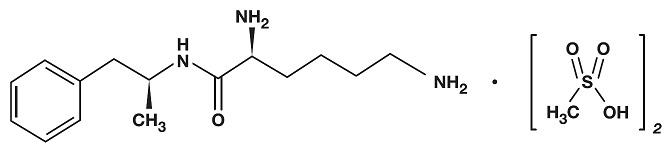
Figure-1 (Figure 1)

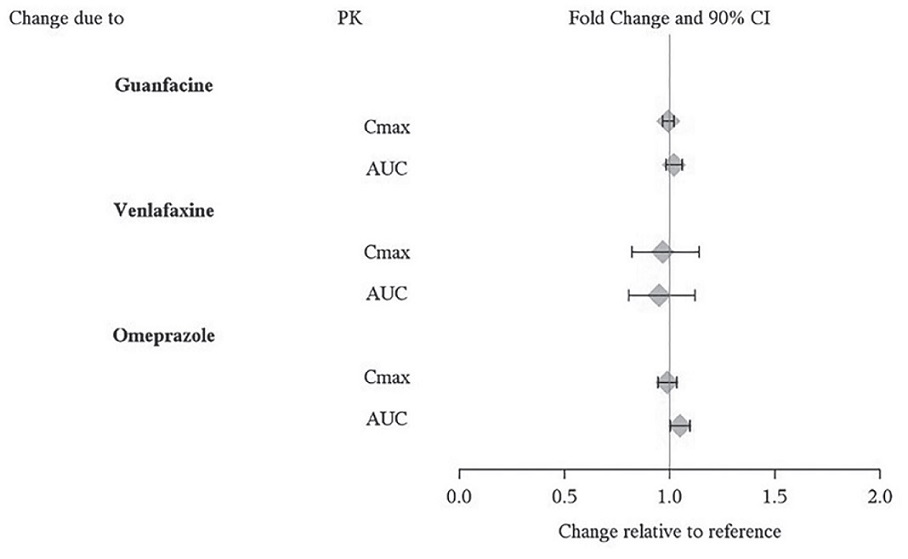
This text appears to be a table or list containing information about a special population's characteristics and certain measurements. The table includes categories such as gender, age, renal impairment, end-stage renal disease, PK (possibly referring to pharmacokinetics), Cmax (presumably a measure of maximum concentration), AUC (possibly an abbreviation for area under the curve), fold change, and 90% confidence interval. The specific values within each category are not clear from the provided text.*