Divalproex Sodium Tablet, Delayed Release
Product Images NDC 72162-2316

View Photos of Packaging, Regulatory Labels, and Product Appearance

Product Visual Gallery

This gallery contains 6 technical images submitted to the FDA as part of the official labeling for Divalproex Sodium (NDC 72162-2316). Unlike standard consumer photos, these assets often include clinical data figures, molecular chemical structures, and official manufacturer packaging layouts.

As provided by Bryant Ranch Prepack, these visuals offer a comprehensive scientific overview of the product's physical and chemical identity, aiding pharmacists and researchers in product verification and study.

FDA Label Image

Label (Lbl721622316)
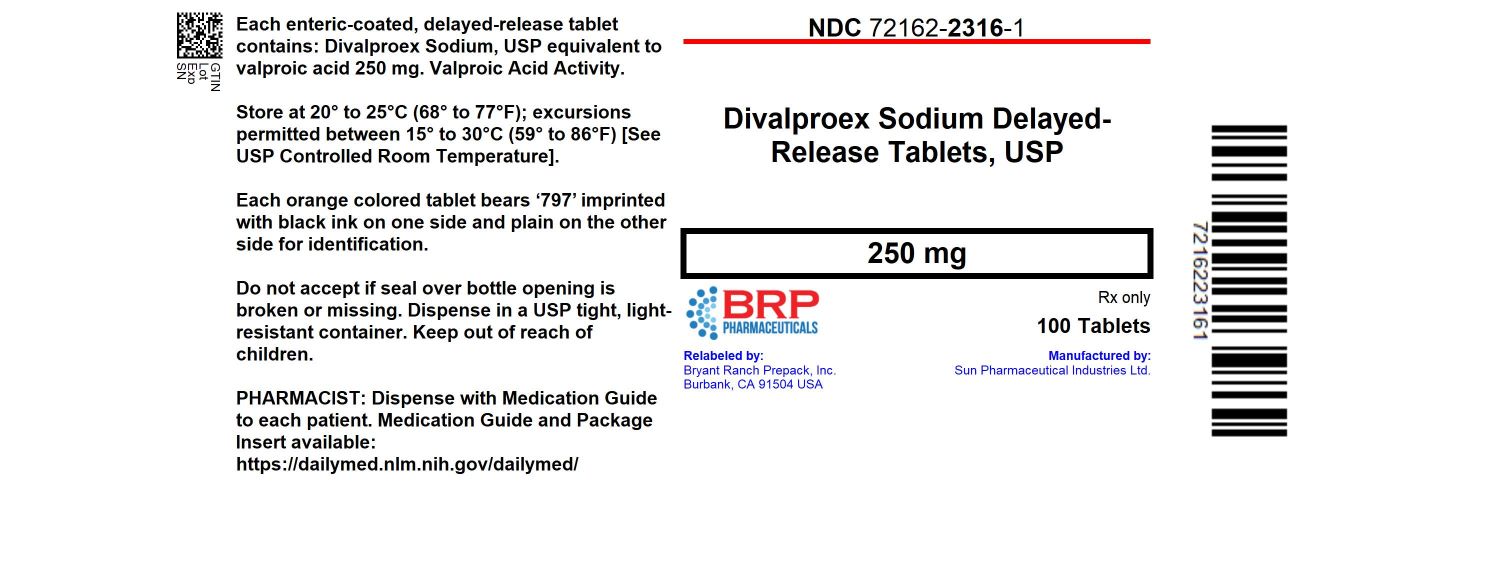
Label (Lbl721622316)
Label for Divalproex Sodium Delayed-Release Tablets, USP 250 mg. The label includes the NDC 72162-2316-1, indicates the package contains 100 tablets, and shows the BRP Pharmaceuticals logo. Storage instructions and tablet identification details are also present. The product is relabeled by Bryant Ranch Prepack and manufactured by Sun Pharmaceutical Industries Ltd.*
FDA Label Image

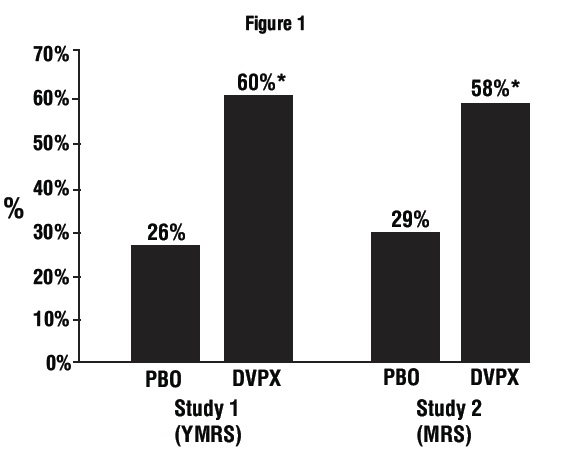
Spl-divalproex-figure-1 (Spl Divalproex Figure 1)

Spl-divalproex-figure-1 (Spl Divalproex Figure 1)
A bar graph labeled Figure 1 comparing percentage outcomes between placebo (PBO) and Divalproex Sodium (DVPX) in two studies, Study 1 (YMRS) and Study 2 (MRS). The Y-axis shows percentages from 0% to 70%, with DVPX bars showing higher percentages (60% and 58%) than placebo (26% and 29%) in both studies.*
FDA Label Image

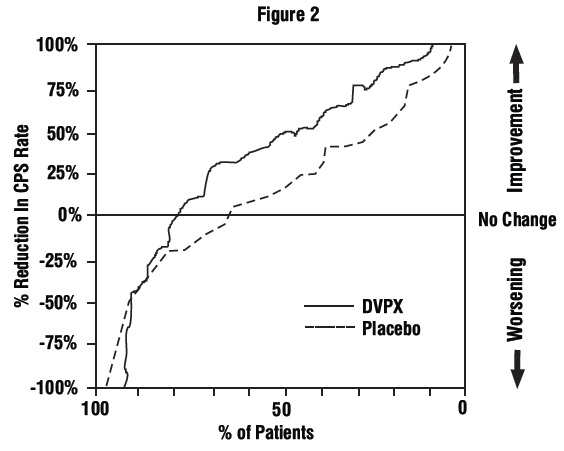
Spl-divalproex-figure-2 (Spl Divalproex Figure 2)

Spl-divalproex-figure-2 (Spl Divalproex Figure 2)
A cumulative distribution plot comparing percentage reduction in CPS rate versus percentage of patients for Divalproex Sodium (DVPX) and placebo groups. The y-axis shows percent reduction in CPS rate from -100% to 100%, indicating worsening to improvement, while the x-axis shows percent of patients from 100% to 0%. Two lines represent data for DVPX and placebo groups respectively.*
FDA Label Image

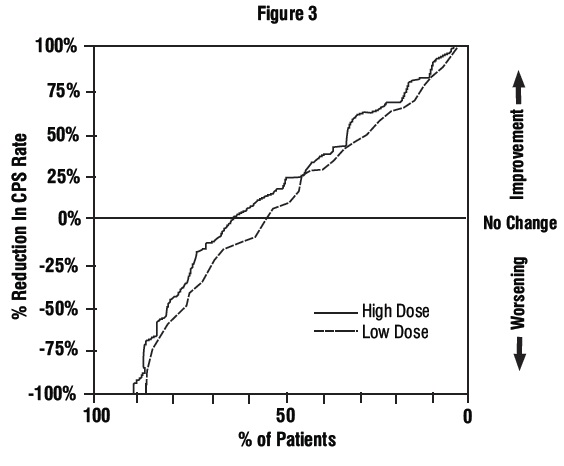
Spl-divalproex-figure-3 (Spl Divalproex Figure 3)

Spl-divalproex-figure-3 (Spl Divalproex Figure 3)
A cumulative distribution plot labeled Figure 3 showing percentage reduction in CPS rate on the vertical axis and percentage of patients on the horizontal axis. Two dose groups, High Dose (solid line) and Low Dose (dashed line), are compared. The graph indicates patient improvement or worsening with improvement upward and worsening downward on the vertical axis.*
FDA Label Image

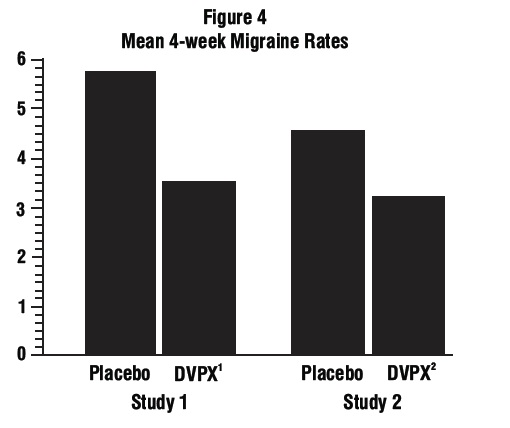
Spl-divalproex-figure-4 (Spl Divalproex Figure 4)

Spl-divalproex-figure-4 (Spl Divalproex Figure 4)
Bar chart titled 'Figure 4 Mean 4-week Migraine Rates' comparing migraine rates in two studies. The chart shows higher rates for placebo groups versus Divalproex Sodium (DVPX) groups in both studies, with numeric values along the vertical axis ranging from 0 to 6.*
FDA Label Image

Spl-divalproex-structure (Spl Divalproex Structure)

Spl-divalproex-structure (Spl Divalproex Structure)
Chemical structure diagram of Divalproex Sodium, showing the molecular formula including sodium ion, carbons, hydrogens, and associated bonds in a repeated polymeric form.*

* About these descriptions: Image descriptions on this page are generated by automated AI analysis of the product label images from the manufacturer's FDA label submission (SPL). They are provided for reference only and may contain errors or omissions. Always rely on the printed label itself and the official FDA labeling, and consult a pharmacist or healthcare professional with any questions about this product.