Lisdexamfetamine Dimesylate Capsule
Product Images NDC 72162-2456

View Photos of Packaging, Regulatory Labels, and Product Appearance

Product Visual Gallery

This gallery contains 10 technical images submitted to the FDA as part of the official labeling for Lisdexamfetamine Dimesylate (NDC 72162-2456). Unlike standard consumer photos, these assets often include clinical data figures, molecular chemical structures, and official manufacturer packaging layouts.

As provided by Bryant Ranch Prepack, these visuals offer a comprehensive scientific overview of the product's physical and chemical identity, aiding pharmacists and researchers in product verification and study.

FDA Label Image

Label (Lbl721622456)

Label (Lbl721622456)
Label for Lisdexamfetamine Dimesylate Capsules 50 mg by Bryant Ranch Prepack, relabeled and manufactured by Purdue Pharma L.P. The label indicates a 100 capsule package, includes storage instructions (20° to 25°C, with excursions permitted to 15° to 30°C), caution to keep out of reach of children, and a note to dispense the medication guide to patients. Two QR codes are present for dosage information and package insert.*
FDA Label Image

Chemical Structure (Lisdexcaps 01)

Chemical Structure (Lisdexcaps 01)
Chemical structure diagram of lisdexamfetamine dimesylate, showing its molecular components including the amine groups and the dimethyl sulfonate groups.*
FDA Label Image

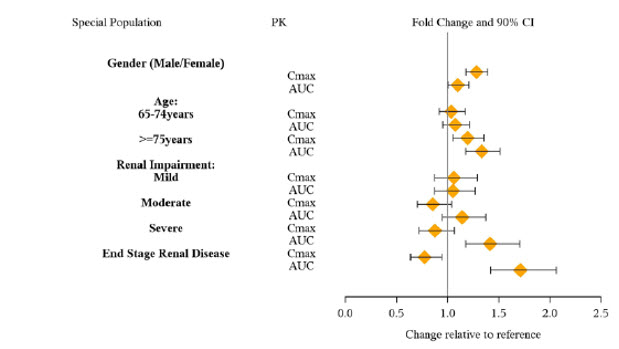
Figure 1 (Lisdexcaps 02)

Figure 1 (Lisdexcaps 02)
A forest plot chart depicting fold changes with 90% confidence intervals in pharmacokinetic parameters Cmax and AUC across special populations, including gender, age groups 65-74 years and ≥75 years, renal impairment levels (mild, moderate, severe), and end stage renal disease, relative to a reference group.*
FDA Label Image

Figure 2 (Lisdexcaps 03)

Figure 2 (Lisdexcaps 03)
A chart showing the fold change and 90% confidence intervals in pharmacokinetic parameters (Cmax and AUC) for Guanfacine, Venlafaxine, and Omeprazole. The x-axis represents change relative to reference, ranging from 0.0 to 2.0, with data points plotted near 1.0 indicating no substantial change in exposure for these drugs.*
FDA Label Image

Figure 3 (Lisdexcaps 04)

Figure 3 (Lisdexcaps 04)
A forest plot chart showing fold changes and 90% confidence intervals for pharmacokinetic parameters Cmax and AUC of various interacting drugs with LISDEXAMFETAMINE DIMESYLATE. The drugs include Guanfacine, Venlafaxine, CYP1A2 substrates (Caffeine), CYP2D6 substrates (Dextromethorphan), CYP2C19 substrates (Omeprazole), and CYP3A substrates (Midazolam). The x-axis indicates fold change relative to reference.*
FDA Label Image

Figure 4 (Lisdexcaps 05)

Figure 4 (Lisdexcaps 05)
A line graph comparing LS mean (SE) SKAMP Deportment Scores over time post-dose (hours) between placebo and lisdexamfetamine. Placebo scores are shown with a dashed line higher over time, while lisdexamfetamine scores are lower initially and increase slightly toward the end. Error bars indicate variability at each time point.*
FDA Label Image

Figure 5 (Lisdexcaps 06)

Figure 5 (Lisdexcaps 06)
A line graph illustrating the proportion of subjects with relapse or treatment failure over time (days after randomization) comparing Lisdexamfetamine versus placebo. The solid line represents Lisdexamfetamine and shows a lower proportion of relapse over time, while the dashed line represents placebo with a higher, increasing relapse proportion.*
FDA Label Image

Figure 6 (Lisdexcaps 07)

Figure 6 (Lisdexcaps 07)
A line graph comparing LS Mean (SE) PERMP Total Scores over time post-dose (hours) between Lisdexamfetamine and placebo. The x-axis shows time from -0.5 to 14 hours, and the y-axis shows scores from 250 to 330. Lisdexamfetamine is represented by a solid line showing a higher score increase compared to placebo, which is shown with a dashed line, indicating lower scores across the time points.*
FDA Label Image

Figure 7 (Lisdexcaps 08)

Figure 7 (Lisdexcaps 08)
A line graph showing the proportion of subjects with relapse or treatment failure over time in days after randomization, comparing placebo (dashed line) and lisdexamfetamine (solid line). The graph indicates a higher proportion of relapse/treatment failure in the placebo group compared to the lisdexamfetamine group throughout the study period.*
FDA Label Image

Figure 8 (Lisdexcaps 09)

Figure 8 (Lisdexcaps 09)
A line graph comparing the proportion of subjects with relapse (%) over time (days after randomization) between lisdexamfetamine and placebo groups. The graph includes a legend and tables showing the number of subjects at risk at various time points for both groups.*

* About these descriptions: Image descriptions on this page are generated by automated AI analysis of the product label images from the manufacturer's FDA label submission (SPL). They are provided for reference only and may contain errors or omissions. Always rely on the printed label itself and the official FDA labeling, and consult a pharmacist or healthcare professional with any questions about this product.