Pirfenidone Tablet, Coated
Product Images NDC 72162-2466

View Photos of Packaging, Regulatory Labels, and Product Appearance

Product Visual Gallery

This gallery contains 7 technical images submitted to the FDA as part of the official labeling for Pirfenidone (NDC 72162-2466). Unlike standard consumer photos, these assets often include clinical data figures, molecular chemical structures, and official manufacturer packaging layouts.

As provided by Bryant Ranch Prepack, these visuals offer a comprehensive scientific overview of the product's physical and chemical identity, aiding pharmacists and researchers in product verification and study.

FDA Label Image

Label (Lbl721622466)

Label (Lbl721622466)
Label for Pirfenidone Tablets 801 mg, coated tablets for oral use. The label shows the product NDC 72162-2466-9 and states a package size of 90 tablets. It includes storage instructions, manufacturer Alembic Pharmaceuticals Limited, and relabeler Bryant Ranch Prepack, Inc.*
FDA Label Image

Figure 1 (Pirfenidone Figure1)

Figure 1 (Pirfenidone Figure1)
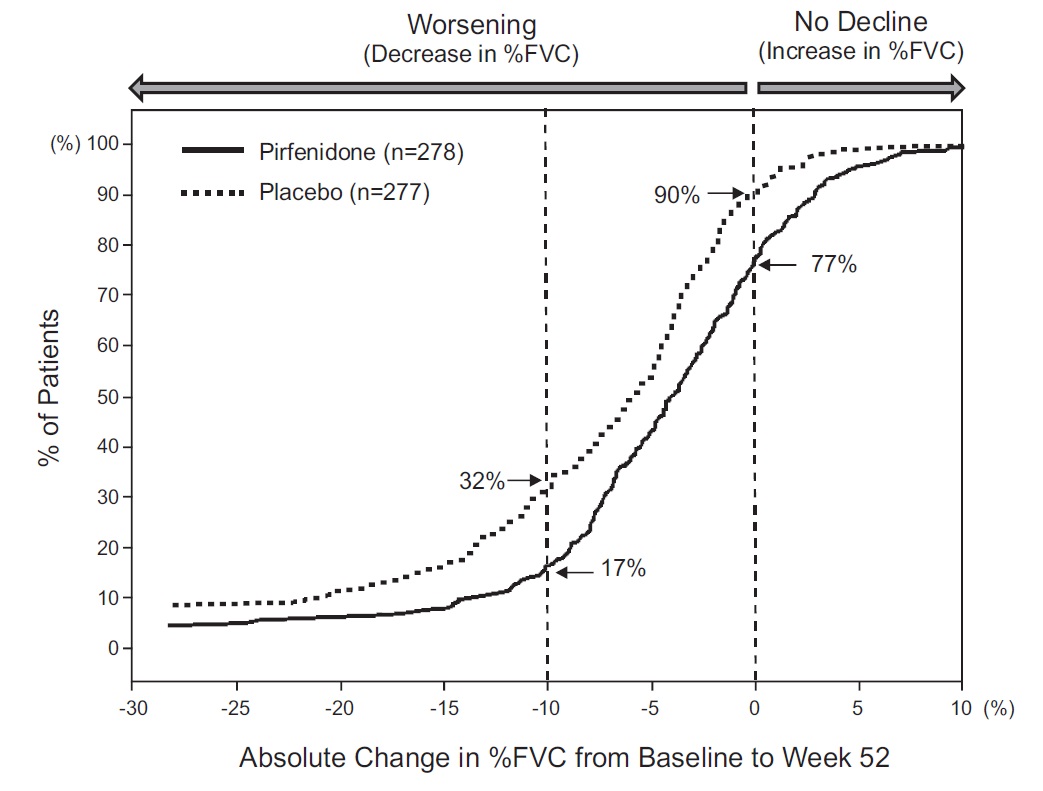
A cumulative distribution plot comparing the absolute change in percent forced vital capacity (%FVC) from baseline to week 52 between Pirfenidone and placebo groups. The X-axis shows %FVC change, with negative values indicating worsening and positive values indicating no decline. The Y-axis shows the percentage of patients. Two curves represent Pirfenidone (solid line, n=278) and placebo (dotted line, n=277), with data points highlighting 17% and 77% for Pirfenidone and 32% and 90% for placebo at specific changes in %FVC.*
FDA Label Image

Figure 2 (Pirfenidone Figure2)

Figure 2 (Pirfenidone Figure2)
A line graph comparing mean change in FVC (mL) over 52 weeks between two groups: Pirfenidone (n=278) represented by a solid line with square markers, and Placebo (n=277) represented by a dashed line with triangle markers. The graph shows changes at weeks 0, 13, 26, 39, and 52, with Pirfenidone consistently showing less decline in FVC compared to Placebo.*
FDA Label Image

Figure 3 (Pirfenidone Figure3)

Figure 3 (Pirfenidone Figure3)
A Kaplan-Meier survival curve chart showing the percentage of patients alive over time (weeks) comparing Pirfenidone (solid line, n=623) versus placebo (dotted line, n=624). The chart includes a hazard ratio (HR) with 95% confidence interval (CI) and displays numbers of patients at risk at various time points up to 120 weeks.*
FDA Label Image

Pirfenidone-pi-table1 (Pirfenidone Pi Table 1)

Pirfenidone-pi-table1 (Pirfenidone Pi Table 1)
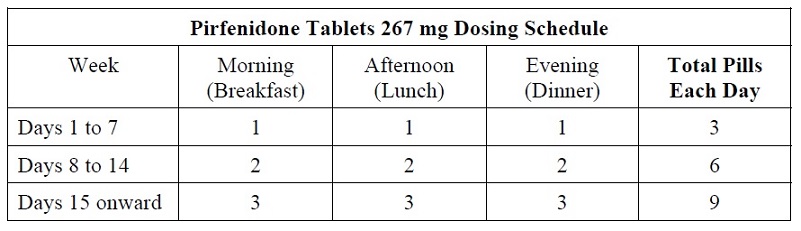
A dosing schedule table for Pirfenidone tablets 267 mg showing the number of tablets to take in the morning, afternoon, and evening over different weeks. It lists 1 tablet three times daily for days 1 to 7, 2 tablets three times daily for days 8 to 14, and 3 tablets three times daily from day 15 onward, with total daily pills increasing from 3 to 9.*
FDA Label Image

Pirfenidone-pi-table-2 (Pirfenidone Pi Table 2)

Pirfenidone-pi-table-2 (Pirfenidone Pi Table 2)
Table showing the dosing schedule for Pirfenidone Tablets 801 mg, indicating that from Day 15 onward, the patient should take one tablet each in the morning, afternoon, and evening, totaling three pills daily.*
FDA Label Image

Pirfenidone (Pirfenidone Structure)

Pirfenidone (Pirfenidone Structure)
Chemical structure of pirfenidone, showing its molecular framework with a pyridinone and phenyl group connected by a nitrogen atom and a methyl group attached to the pyridinone ring.*

* About these descriptions: Image descriptions on this page are generated by automated AI analysis of the product label images from the manufacturer's FDA label submission (SPL). They are provided for reference only and may contain errors or omissions. Always rely on the printed label itself and the official FDA labeling, and consult a pharmacist or healthcare professional with any questions about this product.