Tamsulosin Hydrochloride Capsule
Product Images NDC 72162-2502

View Photos of Packaging, Regulatory Labels, and Product Appearance

Product Visual Gallery

This gallery contains 7 technical images submitted to the FDA as part of the official labeling for Tamsulosin Hydrochloride (NDC 72162-2502). Unlike standard consumer photos, these assets often include clinical data figures, molecular chemical structures, and official manufacturer packaging layouts.

As provided by Bryant Ranch Prepack, these visuals offer a comprehensive scientific overview of the product's physical and chemical identity, aiding pharmacists and researchers in product verification and study.

FDA Label Image

Label (Lbl721622502)

Label (Lbl721622502)
Label for Tamsulosin Hydrochloride Capsules, USP 0.4 mg, oral dosage form. The label indicates a package of 100 capsules with NDC 72162-2502-1. It is relabeled by Bryant Ranch Prepack, Inc. and manufactured by Macleods Pharmaceuticals Ltd. Storage instructions and a QR code for the package insert are also present.*
FDA Label Image

Fig (Tamsulosin Fig 1)

Fig (Tamsulosin Fig 1)
A plasma concentration versus time graph for Tamsulosin Hydrochloride showing the drug concentration (ng/mL) on the y-axis and time (hours) on the x-axis. The graph compares plasma levels after fasting and fed conditions, with fasting indicated by a dashed line and fed by a solid line over a 36-hour period.*
FDA Label Image

Fig (Tamsulosin Fig 2a)

Fig (Tamsulosin Fig 2a)
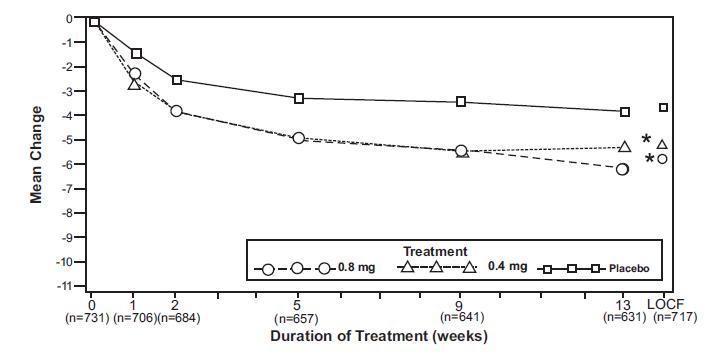
A line graph showing mean change over duration of treatment in weeks for Tamsulosin Hydrochloride. The graph compares treatments of 0.8 mg, 0.4 mg doses, and placebo, each represented by distinct markers. The x-axis indicates treatment duration from baseline to 13 weeks, and the y-axis shows mean change values, with the treatment groups showing greater mean change than placebo over time.*
FDA Label Image

Fig (Tamsulosin Fig 2b)

Fig (Tamsulosin Fig 2b)
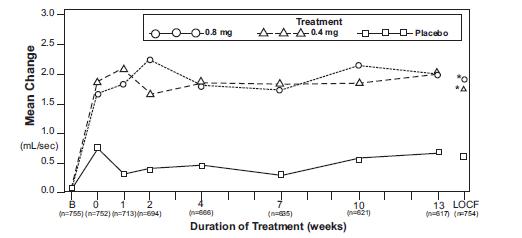
A line graph depicting the mean change in response over a 13-week treatment duration for Tamsulosin Hydrochloride capsules at 0.4 mg and 0.8 mg doses versus placebo. The x-axis represents weeks of treatment, and the y-axis shows mean change values. The graph includes data points with sample sizes at multiple time intervals and identifies treatment groups by distinct symbols.*
FDA Label Image

Fig (Tamsulosin Fig 3a)

Fig (Tamsulosin Fig 3a)
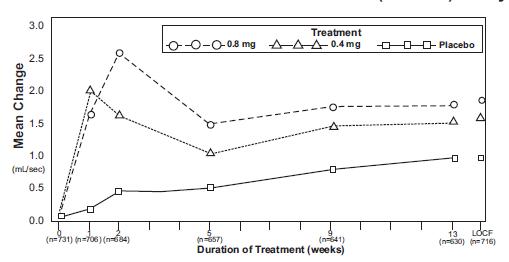
A line chart displaying mean change in an unspecified measurement (mL/sec) over treatment duration in weeks for three groups: 0.8 mg, 0.4 mg, and placebo. The chart shows data points from baseline up to 13 weeks, comparing the effects of two treatment doses and placebo with sample sizes noted for each time point.*
FDA Label Image

Fig (Tamsulosin Fig 3b)

Fig (Tamsulosin Fig 3b)
A line graph depicting mean change in a measure (mL/sec) over duration of treatment in weeks. The graph compares three groups: 0.8 mg treatment, 0.4 mg treatment, and placebo. Each group is represented by different markers connected by dashed or dotted lines, showing changes over time from week 0 to week 13 and LOCF (last observation carried forward).*
FDA Label Image

Str (Tamsulosin Str)

Str (Tamsulosin Str)
Chemical structure of Tamsulosin Hydrochloride, showing its molecular formula with labeled functional groups and atoms, including aromatic rings and side chains, as depicted in the image.*

* About these descriptions: Image descriptions on this page are generated by automated AI analysis of the product label images from the manufacturer's FDA label submission (SPL). They are provided for reference only and may contain errors or omissions. Always rely on the printed label itself and the official FDA labeling, and consult a pharmacist or healthcare professional with any questions about this product.