Darifenacin Tablet, Extended Release
Product Images NDC 72162-2571

View Photos of Packaging, Regulatory Labels, and Product Appearance

Product Visual Gallery

This gallery contains 8 technical images submitted to the FDA as part of the official labeling for Darifenacin (NDC 72162-2571). Unlike standard consumer photos, these assets often include clinical data figures, molecular chemical structures, and official manufacturer packaging layouts.

As provided by Bryant Ranch Prepack, these visuals offer a comprehensive scientific overview of the product's physical and chemical identity, aiding pharmacists and researchers in product verification and study.

FDA Label Image

Logo1 (06torrentlogo1)

FDA Label Image

Logo2 (07torrentlogo2)

FDA Label Image

Figure1 (Figure 1)

Figure1 (Figure 1)
A line graph showing mean Darifenacin plasma concentration (ng/mL) over 24 hours post-dose for two dosages: 7.5 mg and 15 mg once daily (od). The graph plots plasma concentration on the y-axis against time post-dose in hours on the x-axis, with error bars indicating standard deviation. The 15 mg dose shows higher plasma concentrations compared to the 7.5 mg dose throughout the 24-hour period.*
FDA Label Image

Figure 2a Study 1 (Figure2a Study1)

Figure 2a Study 1 (Figure2a Study1)
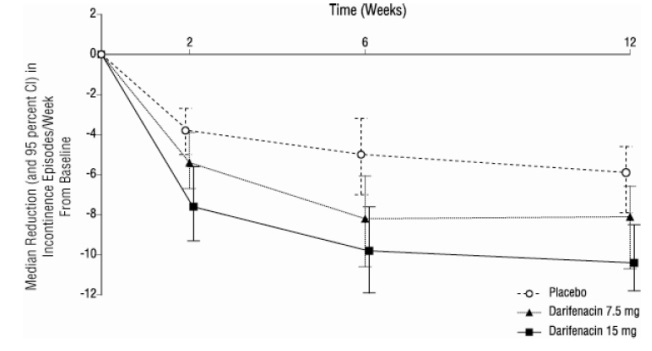
A line graph showing median reduction and 95 percent confidence intervals in incontinence episodes per week from baseline over 12 weeks. The x-axis represents time in weeks (0, 2, 6, 12), and the y-axis represents reduction in episodes from baseline. Three groups are shown: placebo, Darifenacin 7.5 mg, and Darifenacin 15 mg, with the 15 mg dose showing the greatest reduction over time.*
FDA Label Image

Figure 2b Study 2 (Figure2b Study2)

Figure 2b Study 2 (Figure2b Study2)
A line graph depicting median reduction in incontinence episodes per week from baseline over 12 weeks. Three groups are shown: placebo (open circles), darifenacin 7.5 mg (triangles), and darifenacin 15 mg (squares). Both darifenacin doses show a greater reduction compared to placebo throughout the study period.*
FDA Label Image

Figure 2c Study 3 (Figure2c Study3)

Figure 2c Study 3 (Figure2c Study3)
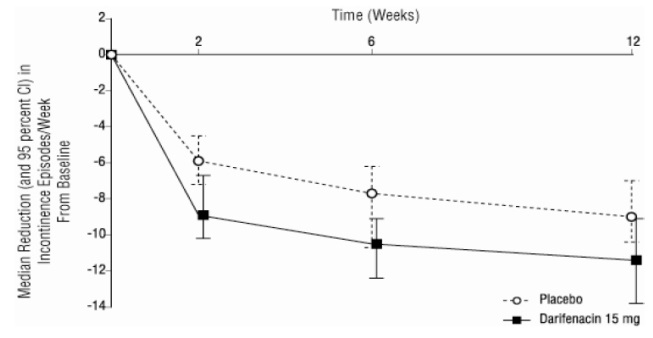
A line graph depicting median reduction in incontinence episodes per week from baseline over a 12-week period. Two lines represent placebo (open circles) and Darifenacin 15 mg (solid squares), showing greater reduction for Darifenacin 15 mg across weeks 2, 6, and 12. Error bars indicate 95% confidence intervals.*
FDA Label Image

Label (Lbl721622571)

Label (Lbl721622571)
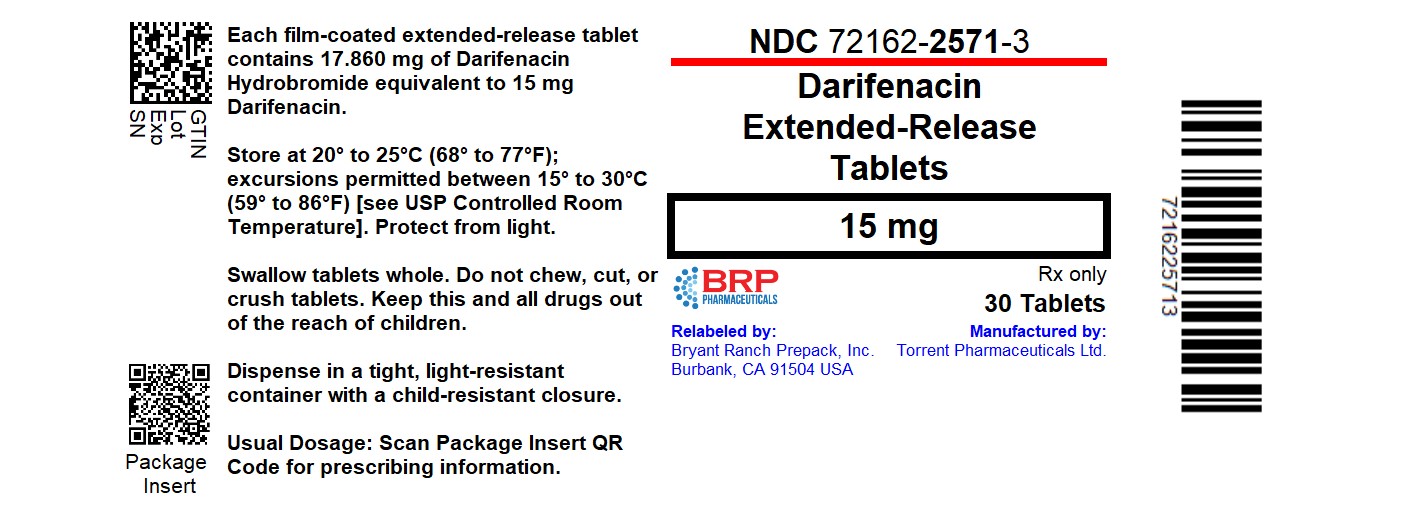
Label for Darifenacin extended-release 15 mg tablets shows a white background with black text, including NDC 72162-2571. The label states the strength as 15 mg and the package contains 30 tablets. It also mentions Bryant Ranch Prepack as the relabeler and Torrent Pharmaceuticals Ltd. as the manufacturer. Storage and usage instructions are included, along with two QR codes.*
FDA Label Image

Structure (Structure)

Structure (Structure)
Chemical structure diagram of the active ingredient Darifenacin, showing its molecular framework with labeled chemical groups.*

* About these descriptions: Image descriptions on this page are generated by automated AI analysis of the product label images from the manufacturer's FDA label submission (SPL). They are provided for reference only and may contain errors or omissions. Always rely on the printed label itself and the official FDA labeling, and consult a pharmacist or healthcare professional with any questions about this product.