Sotalol Hydrochloride Tablet
Product Images NDC 72162-2583

View Photos of Packaging, Regulatory Labels, and Product Appearance

Product Visual Gallery

This gallery contains 5 technical images submitted to the FDA as part of the official labeling for Sotalol Hydrochloride (NDC 72162-2583). Unlike standard consumer photos, these assets often include clinical data figures, molecular chemical structures, and official manufacturer packaging layouts.

As provided by Bryant Ranch Prepack, these visuals offer a comprehensive scientific overview of the product's physical and chemical identity, aiding pharmacists and researchers in product verification and study.

FDA Label Image

Fig1 (Figure1)

Fig1 (Figure1)
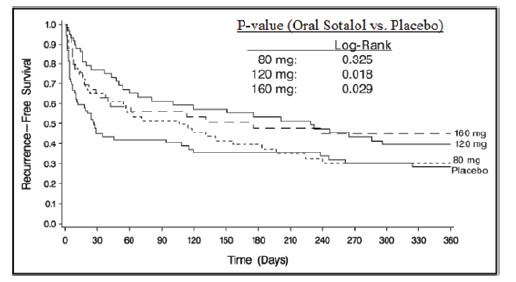
A Kaplan-Meier survival curve chart showing recurrence-free survival over time (days) comparing oral Sotalol at doses of 80 mg, 120 mg, 160 mg, and placebo. The y-axis represents recurrence-free survival probability, and the x-axis shows time in days up to 360. The chart includes p-values from a log-rank test for each dosage versus placebo.*
FDA Label Image

Fig2 (Figure2)

Fig2 (Figure2)
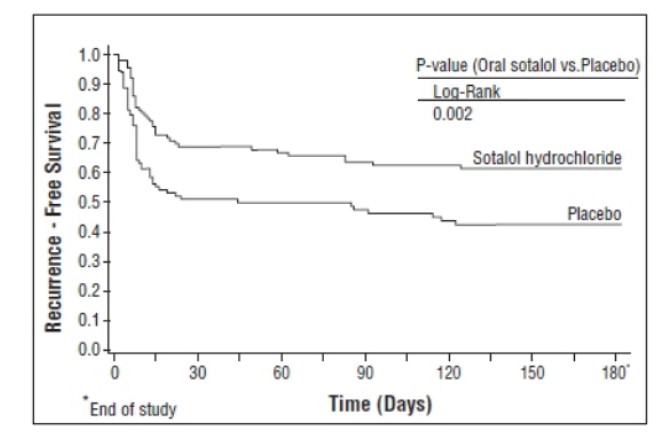
A Kaplan-Meier survival curve chart comparing recurrence-free survival over time (in days) between oral sotalol hydrochloride and placebo groups. The vertical axis represents recurrence-free survival probability, and the horizontal axis represents days up to 180. The chart includes a p-value (0.002) indicating a statistically significant difference between the two groups.*
FDA Label Image

Label (Lbl721622583)

Label (Lbl721622583)
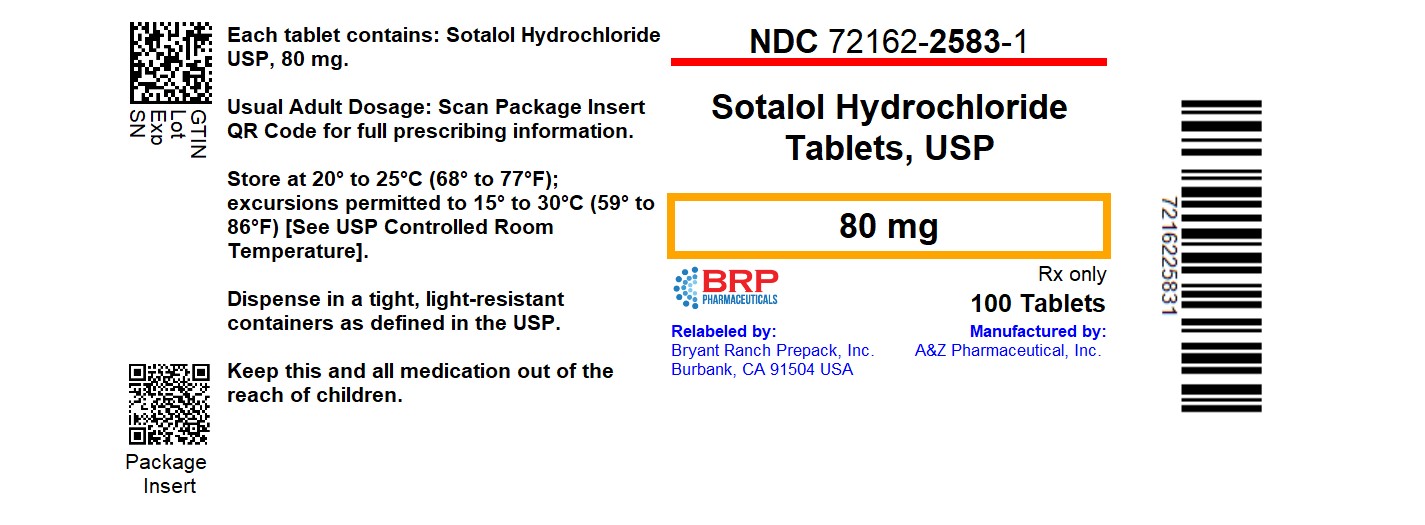
Label for Sotalol Hydrochloride Tablets USP 80 mg, oral tablets, repackaged by Bryant Ranch Prepack and manufactured by A&Z Pharmaceutical Inc. The label includes NDC 72162-2583-1, quantity of 100 tablets, storage instructions, QR codes for package insert and prescribing info, and barcode 7216225831.*
FDA Label Image

Sotalol Structure (Sotaol Structure)

Sotalol Structure (Sotaol Structure)
Chemical structure of Sotalol Hydrochloride depicted as a molecular diagram, showing its key structural components including an aromatic ring, hydroxyl group, and amine groups.*
FDA Label Image

Study-graph1 (Study Graph1)

Study-graph1 (Study Graph1)
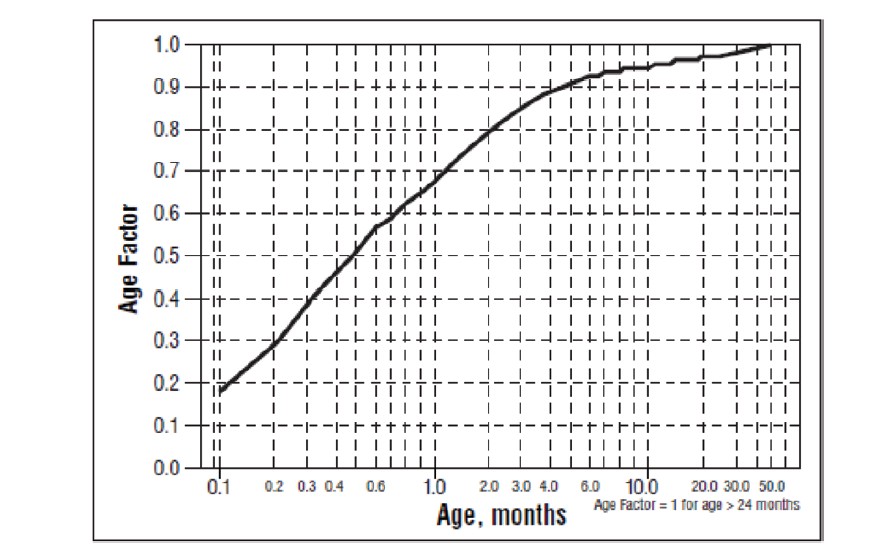
A line graph showing the relationship between Age Factor and Age in months. The graph has Age in months on the horizontal axis with a logarithmic scale ranging approximately from 0.1 to 50 months. The vertical axis shows Age Factor from 0.0 to 1.0. The curve gradually increases and approaches an Age Factor of 1.0 as age exceeds 24 months.*

* About these descriptions: Image descriptions on this page are generated by automated AI analysis of the product label images from the manufacturer's FDA label submission (SPL). They are provided for reference only and may contain errors or omissions. Always rely on the printed label itself and the official FDA labeling, and consult a pharmacist or healthcare professional with any questions about this product.