Paclitaxel Injection, Solution
Product Images NDC 72162-2640

View Photos of Packaging, Regulatory Labels, and Product Appearance

Product Visual Gallery

This gallery contains 10 technical images submitted to the FDA as part of the official labeling for Paclitaxel (NDC 72162-2640). Unlike standard consumer photos, these assets often include clinical data figures, molecular chemical structures, and official manufacturer packaging layouts.

As provided by Bryant Ranch Prepack, these visuals offer a comprehensive scientific overview of the product's physical and chemical identity, aiding pharmacists and researchers in product verification and study.

FDA Label Image

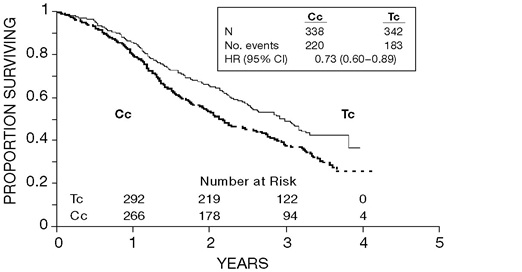
Fig-1 (Figure 1)

Fig-1 (Figure 1)
A Kaplan-Meier survival curve graph showing proportion surviving over a period of 0 to 5 years. The graph compares two groups labeled Cc and Tc, with survival proportions decreasing over time. The number at risk for each group is listed below the x-axis at yearly intervals from 0 to 4 years. A small inset table provides sample sizes, number of events, and hazard ratio with confidence intervals for the groups.*
FDA Label Image

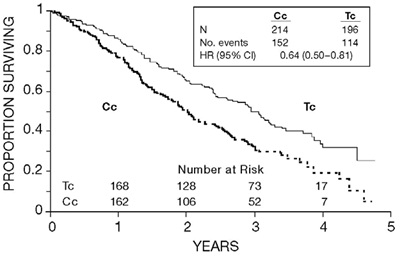
Fig-2 (Figure 2)

Fig-2 (Figure 2)
A survival curve chart depicting proportion surviving over years for two groups labeled 'Cc' and 'Tc'. The graph shows decreasing survival over a 5-year period, with numbers at risk displayed at different time points. An inset table provides sample size, number of events, and hazard ratio with confidence interval for the groups.*
FDA Label Image

Fig-3 (Figure 3)

Fig-3 (Figure 3)
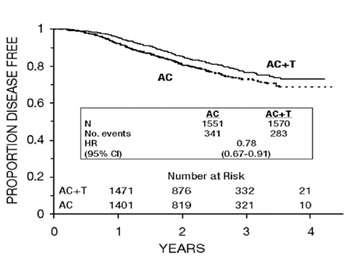
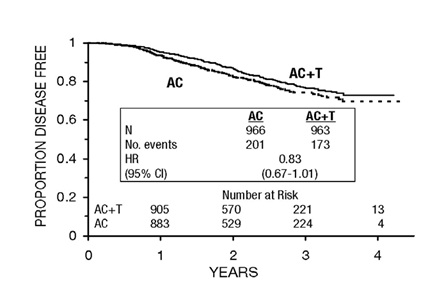
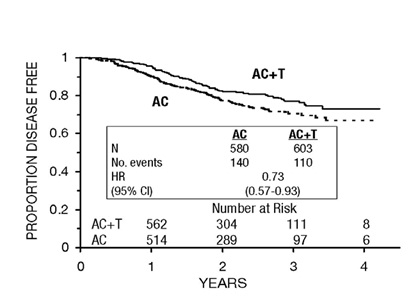
A line graph depicting the proportion of disease-free patients over a period of 4 years, comparing two groups labeled AC and AC+T. The y-axis represents the proportion disease-free, and the x-axis represents years. The graph includes a table showing the number of events, hazard ratio (HR), and 95% confidence interval (CI) for the two groups, along with the number of patients at risk over time.*
FDA Label Image

Fig-4 (Figure 4)

Fig-4 (Figure 4)
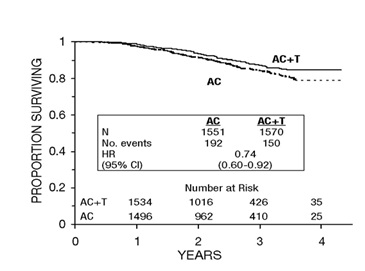
A survival curve chart showing the proportion surviving over a 4-year period comparing two groups: AC and AC+T. The graph includes a table with number of participants, number of events, and hazard ratio (HR) with confidence interval (CI) for each group. The X-axis represents years, and the Y-axis represents the proportion surviving, ranging from 0 to 1.*
FDA Label Image

Fig-5 (Figure 5)

Fig-5 (Figure 5)
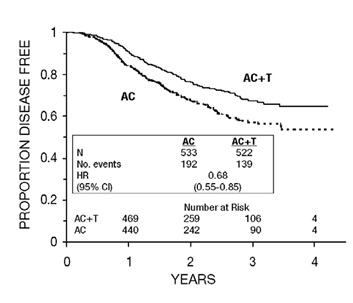
A survival curve chart depicting the proportion of patients disease-free over a period of 0 to 4 years. The chart compares two groups labeled AC and AC+T, showing their disease-free proportions on the Y-axis against years on the X-axis. An inset table provides event counts, hazard ratio, confidence intervals, and numbers at risk for each group over time.*
FDA Label Image

Fig-6 (Figure 6)

Fig-6 (Figure 6)
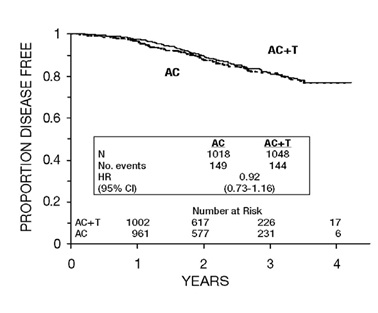
A survival curve chart showing proportion disease-free over time in years for two groups labeled AC and AC+T. The chart includes events count, hazard ratio, and confidence intervals comparing AC and AC+T treatments, with a table of numbers at risk over the 4-year period.*
FDA Label Image

Fig-7 (Figure 7)

Fig-7 (Figure 7)
A Kaplan-Meier curve chart comparing the proportion of disease-free patients over a period of 4 years between two treatment groups labeled AC and AC+T. The graph includes sample sizes, number of events, hazard ratio (HR), confidence interval (CI), and numbers at risk at various time points.*
FDA Label Image

Fig-8 (Figure 8)

Fig-8 (Figure 8)
A Kaplan-Meier survival curve chart depicting the proportion of disease-free patients over a period of 4 years. Two treatment groups are compared: AC and AC+T, with the chart including number of patients (N), number of events, hazard ratio (HR) with 95% confidence interval (CI), and numbers at risk at different time points.*
FDA Label Image

Label (Lbl721622640)

Label (Lbl721622640)
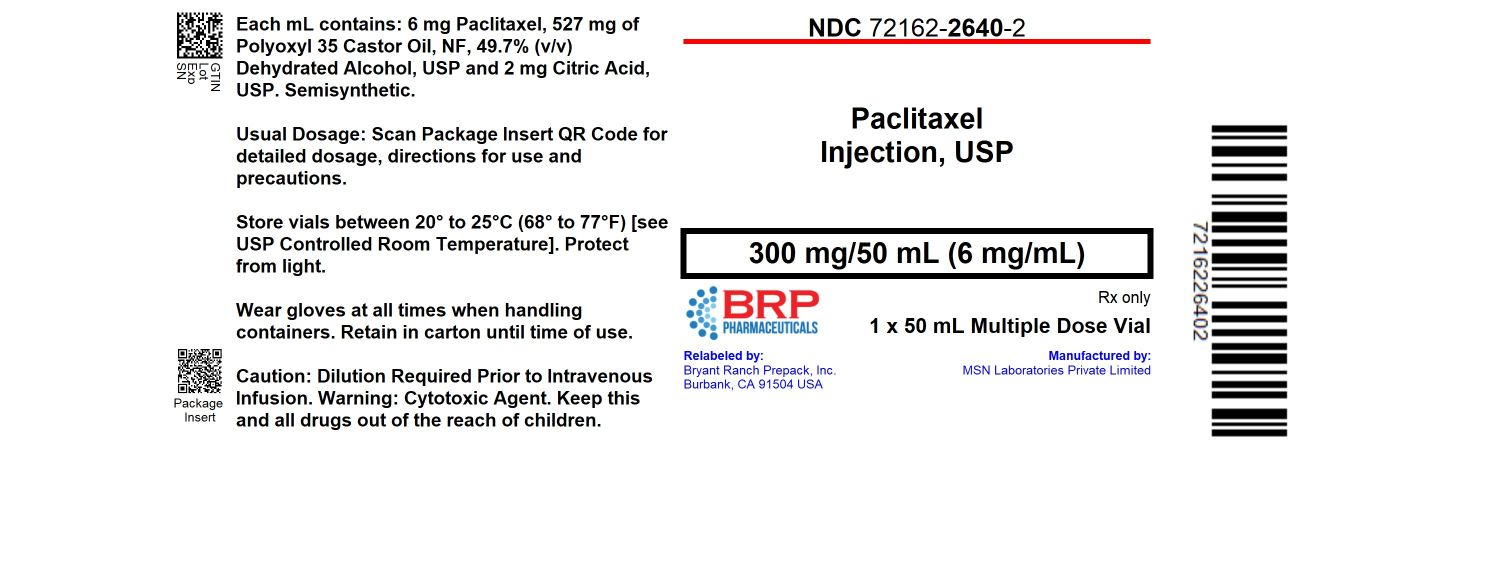
Paclitaxel Injection, USP 300 mg/50 mL (6 mg/mL) multiple dose vial label. The label lists active ingredients, storage instructions, and handling precautions. It is relabeled by Bryant Ranch Prepack, manufactured by MSN Laboratories Private Limited, and includes a barcode and QR codes for package insert and product information.*
FDA Label Image

Structure (Structure)

Structure (Structure)
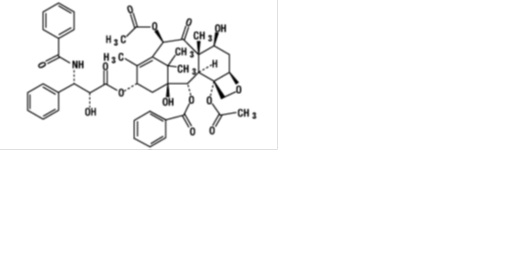
Chemical structure of Paclitaxel, a complex molecule shown with multiple rings, hydroxyl groups, and ester functionalities, as depicted in the image.*

* About these descriptions: Image descriptions on this page are generated by automated AI analysis of the product label images from the manufacturer's FDA label submission (SPL). They are provided for reference only and may contain errors or omissions. Always rely on the printed label itself and the official FDA labeling, and consult a pharmacist or healthcare professional with any questions about this product.