Product Images Capecitabine

View Photos of Packaging, Labels & Appearance

Product Label Images

The following 9 images provide visual information about the product associated with Capecitabine NDC 72205-007 by Novadoz Pharmaceuticals Llc, such as packaging, labeling, and the appearance of the drug itself. This resource could be helpful for medical professionals, pharmacists, and patients seeking to verify medication information and ensure they have the correct product.

150mg-60s - capcetabine 150mg 60s count

150mg-60s - capcetabine 150mg 60s count

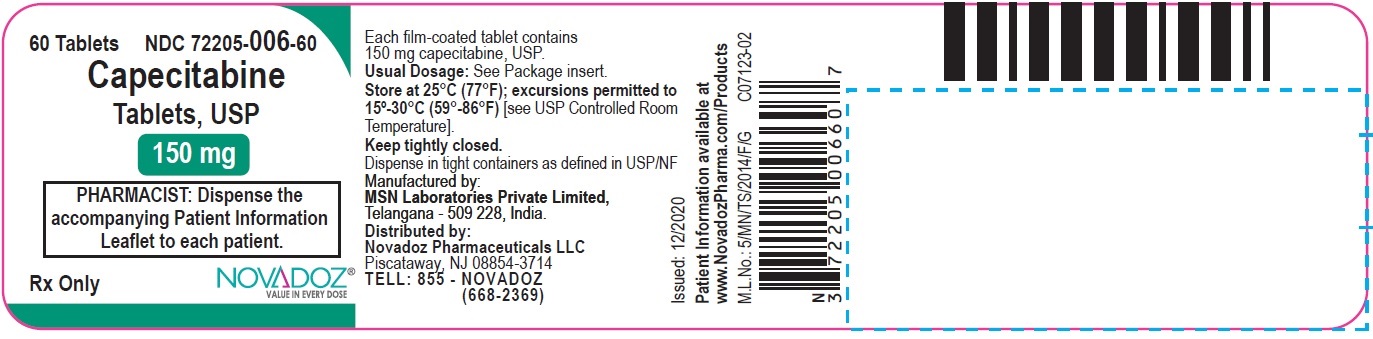
Each film-coated tablet contains 60 tablets. The usual dosage should be seen in the package insert. The tablets should be stored at a temperature of 25°C (77°F) with excursions permitted to 15°-30°C (53°-86°F). Also, the tablets should be kept tightly closed and dispensed in light containers as defined in USPNF. They are manufactured by MSN Laboratories Private Limited, in India. The accompanying Patient Information Leaflet should be given to each patient by the pharmacist. For more information, contact Novadoz at 855 - SEES.*

500mg-120s - capcetabine 500mg 120s count

500mg-120s - capcetabine 500mg 120s count

This is a description of Capecitabine tablets, USP by Novadoz Pharmaceuticals LLC. Each film-coated tablet contains 500mg of Capecitabine, USP. It is a prescription drug that should be dispensed by a pharmacist and comes with an accompanying patient information leaflet. The recommended dosage and other important prescribing information can be found in the insert. The tablets should be stored at a controlled room temperature and tightly closed in containers defined in USP/INF. It is manufactured by MSN Laboratories Private Limited, India, and distributed by Novadoz Pharmaceuticals LLC, Piscataway, NJ. For more patient information, visit their website at www.NovadozPharma.com/Products.*

fig-01 - capecitabine figure 01

fig-01 - capecitabine figure 01

This appears to be a table displaying survival rates over time for two different treatment groups, 5FU+LEUCOVORIN and CAPECITABINE. The table includes the number of participants at risk and the number of months since randomization.*

fig-02 - capecitabine figure 02

fig-02 - capecitabine figure 02

This is a survival chart showing the number of people at risk over time for two treatments: 5FU + LEUCOVORIN and CAPECITABINE. The chart shows the number of people still alive at certain time intervals. The treatment groups are shown at the bottom of the chart.*

fig-03 - capecitabine figure 03

fig-03 - capecitabine figure 03

fig-4 - capecitabine figure 04

fig-4 - capecitabine figure 04

fig-5 - capecitabine figure 05

fig-5 - capecitabine figure 05

This appears to be a table showing estimated probability values for different cancer treatment options with varying dosages and time intervals. The treatments mentioned include Docetaxel and Capecitabine, and the dosage amounts are listed in milligrams/square meter. The time intervals are given in days. However, without further context or explanation, it is difficult to provide more specific information or analysis.*

for - capecitabine formula

for - capecitabine formula

stru - capecitabine structure

stru - capecitabine structure

* The product label images have been analyzed using a combination of traditional computing and machine learning techniques. It should be noted that the descriptions provided may not be entirely accurate as they are experimental in nature. Use the information in this page at your own discretion and risk.