Bortezomib Injection, Powder, Lyophilized, For Solution
Product Images NDC 72338-200

View Photos of Packaging, Regulatory Labels, and Product Appearance

Product Visual Gallery

This gallery contains 12 technical images submitted to the FDA as part of the official labeling for Bortezomib (NDC 72338-200). Unlike standard consumer photos, these assets often include clinical data figures, molecular chemical structures, and official manufacturer packaging layouts.

As provided by Waverley Pharma Inc, these visuals offer a comprehensive scientific overview of the product's physical and chemical identity, aiding pharmacists and researchers in product verification and study.

FDA Label Image

Figure (Bortezomib 01)

Figure (Bortezomib 01)
An equation diagram showing the calculation for Bortezomib injection volume to be administered. It involves dividing the product of Bortezomib for Injection dose (mg/m²) and patient BSA (m²) by 1 mg/mL to determine the total Bortezomib injection volume (mL).*

FDA Label Image

Figure (Bortezomib 02)

Figure (Bortezomib 02)
A formula showing the calculation for the total Bortezomib injection volume (mL) to be administered. It divides the product of Bortezomib injection dose (mg/m2) and patient body surface area (m2) by 2.5 mg/mL.*
FDA Label Image

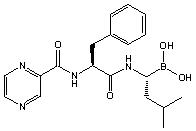
Chemical Structure (Bortezomib 03)

Chemical Structure (Bortezomib 03)
Chemical structure of bortezomib, showing its molecular framework with characteristic boronic acid groups and peptide-like bonds.*
FDA Label Image

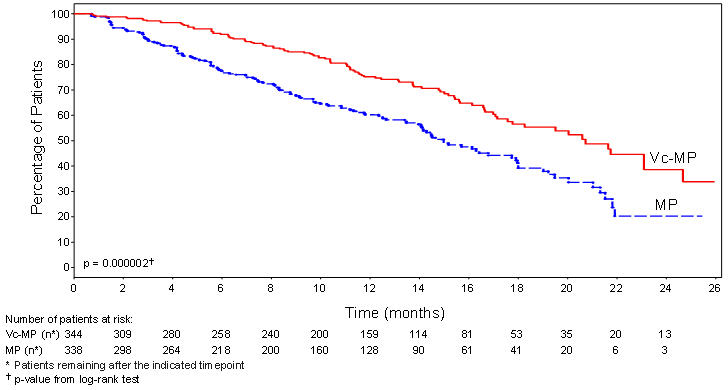
Figure 1 (Bortezomib 04)

Figure 1 (Bortezomib 04)
A survival curve chart comparing two treatment groups labeled Vc-MP and MP. The y-axis shows the percentage of patients, and the x-axis shows time in months up to 26 months. The red solid line represents Vc-MP with consistently higher patient survival percentage than the blue dashed line for MP. The chart includes patient numbers at risk at various time points and a p-value indicating statistical significance from a log-rank test.*
FDA Label Image

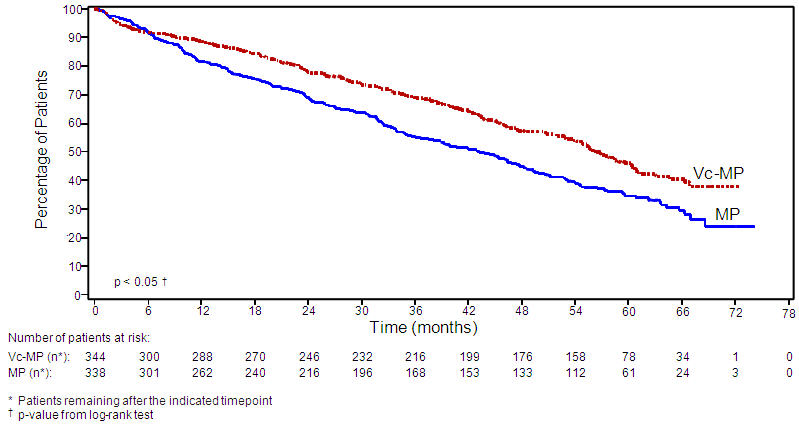
Figure 2 (Bortezomib 05)

Figure 2 (Bortezomib 05)
A Kaplan-Meier survival curve chart showing the percentage of patients over time in months. Two treatment groups are compared: Vc-MP (dashed red line) and MP (solid blue line), with Vc-MP showing higher survival rates throughout. The chart includes the number of patients at risk at various time points and a p-value indication for statistical significance.*
FDA Label Image

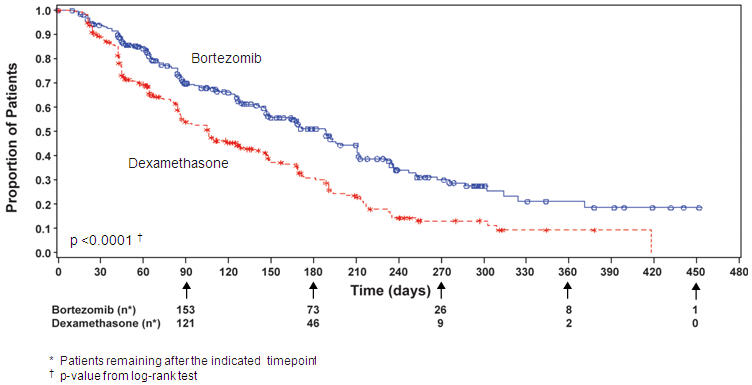
Figure 3 (Bortezomib 06)

Figure 3 (Bortezomib 06)
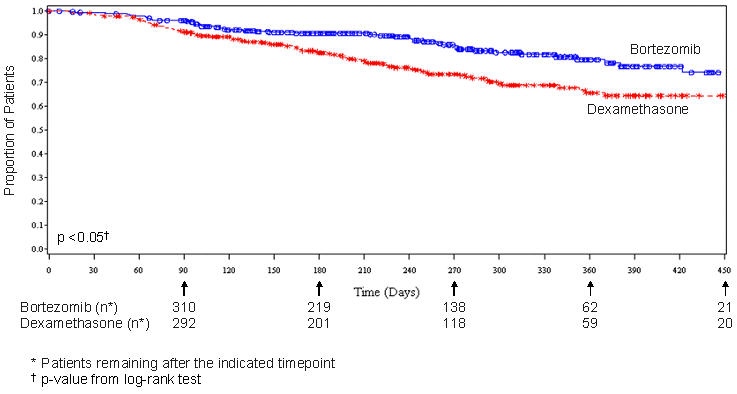
A survival curve chart comparing the proportion of patients over time (days) treated with Bortezomib versus Dexamethasone. The chart shows a declining proportion of patients for both treatments, with Bortezomib consistently maintaining a higher patient proportion. Patient counts at specific time points are noted below the graph. The p-value from the log-rank test is indicated.*
FDA Label Image

Figure 4 (Bortezomib 07)

Figure 4 (Bortezomib 07)
A Kaplan-Meier survival curve comparing the proportion of patients over time (up to 450 days) for two treatments: Bortezomib and Dexamethasone. The graph shows patient survival proportions on the y-axis and days on the x-axis, with Bortezomib having a consistently higher survival proportion compared to Dexamethasone. Patient counts at specific time points are noted below the x-axis along with a p-value indication from a log-rank test.*
FDA Label Image

Figure 5 (Bortezomib 08)

Figure 5 (Bortezomib 08)
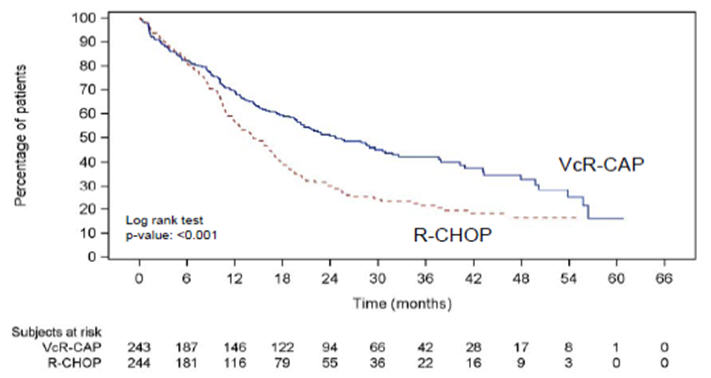
A Kaplan-Meier survival curve chart comparing percentage of patients over time in months for two treatments labeled VcR-CAP and R-CHOP. The chart includes numbers of subjects at risk at different time points and notes a log-rank test p-value of less than 0.001.*
FDA Label Image

Figure 6 (Bortezomib 09)

Figure 6 (Bortezomib 09)
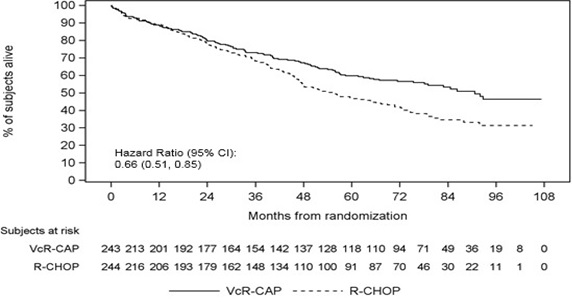
A Kaplan-Meier survival curve chart showing the percentage of subjects alive over time (months from randomization) for two treatment groups labeled VcR-CAP and R-CHOP. The graph presents a hazard ratio with 95% confidence interval. Below the graph, the number of subjects at risk at various time points is listed for each group.*
FDA Label Image

Principal Display Panel (3.5 mg Vial Label)

Principal Display Panel (3.5 mg Vial Label)
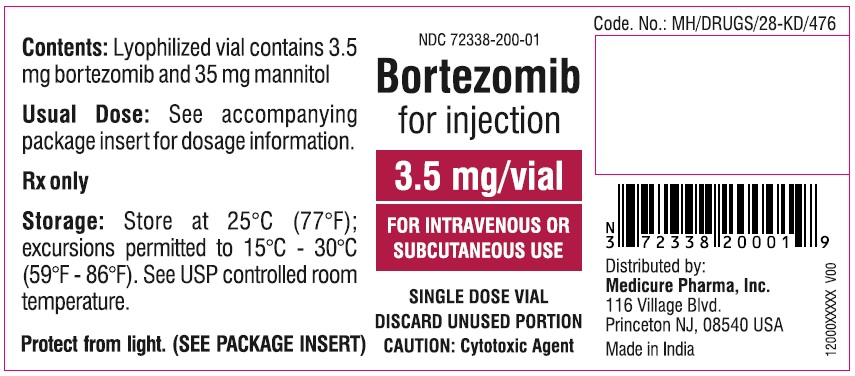
Label for Bortezomib injection powder, lyophilized, 3.5 mg per vial, for intravenous or subcutaneous use. The label indicates it is a single dose vial with cytotoxic agent caution. Distributed by Medicure Pharma, Inc., made in India. Storage instructions and dosage references are included.*
FDA Label Image

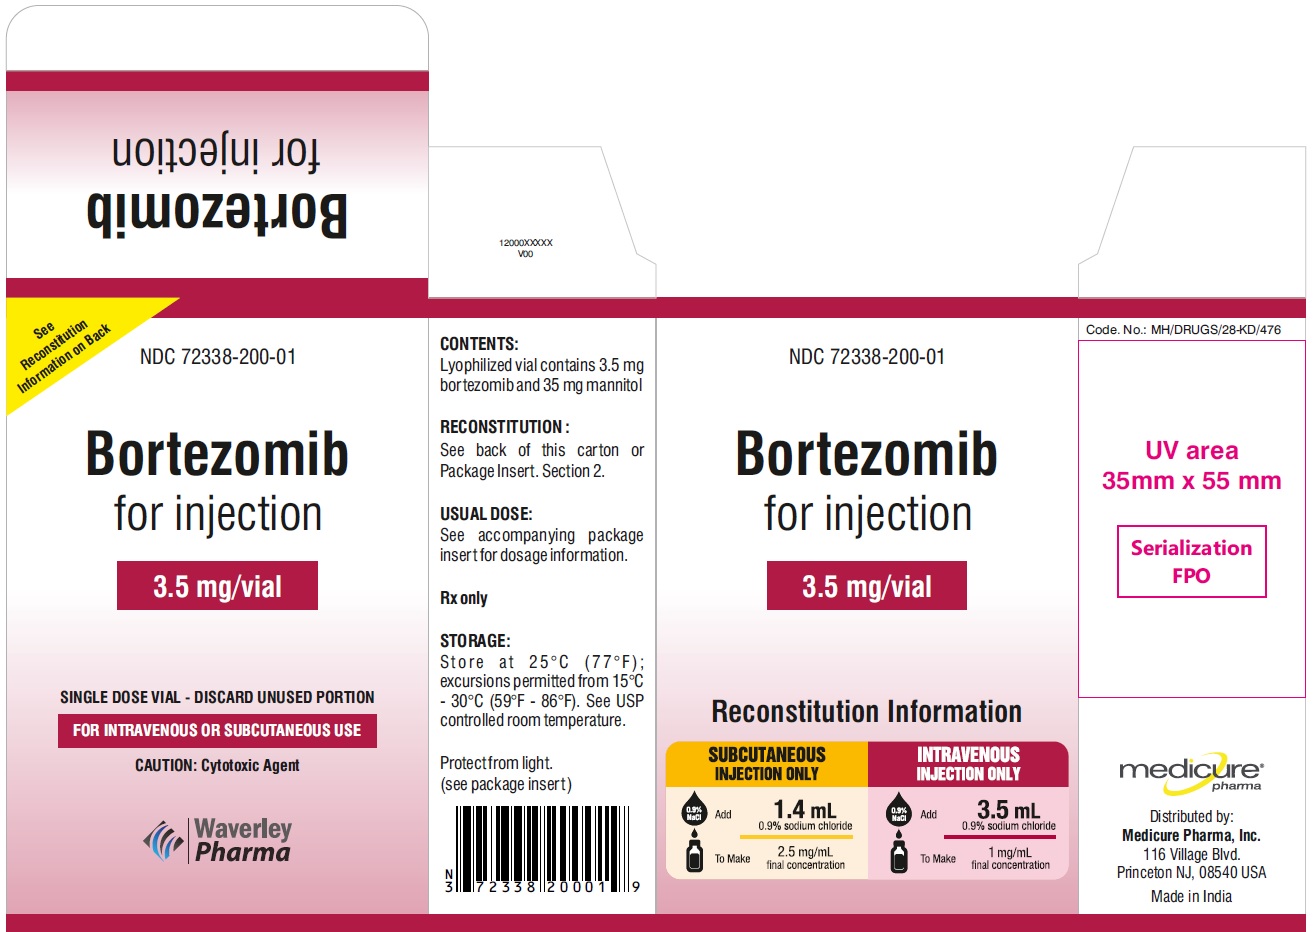
Principal Display Panel (3.5 mg Vial Carton)

Principal Display Panel (3.5 mg Vial Carton)
Packaging label for Bortezomib injection powder, lyophilized for solution, 3.5 mg per vial. The label indicates it is for intravenous or subcutaneous use, distributed by Medicure Pharma, Inc., and labeled by Waverley Pharma. It includes reconstitution instructions specifying different dilution volumes for subcutaneous and intravenous injection methods, from a single-dose vial to be discarded after use. The label features storage instructions and a caution for cytotoxicity.*
FDA Label Image

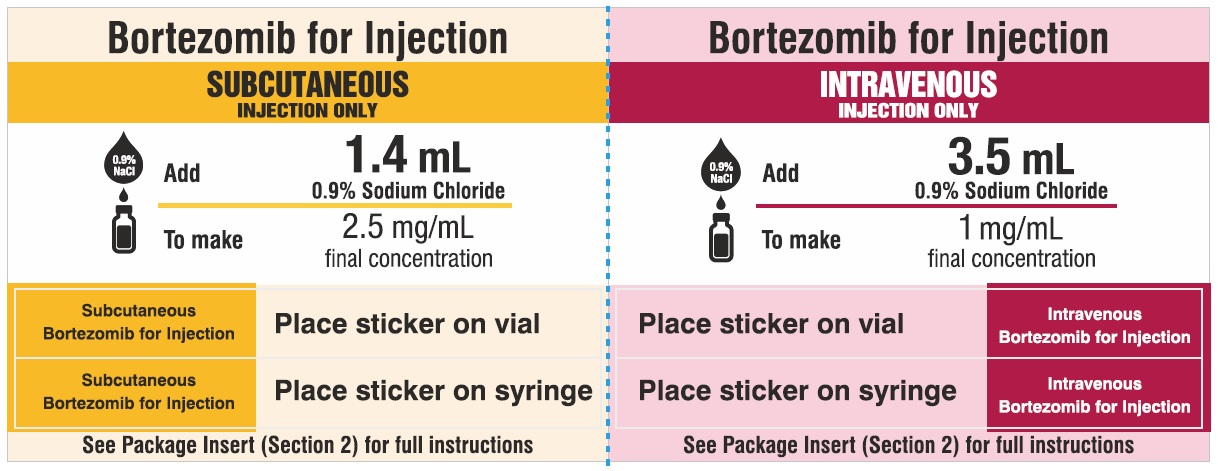
Principal Display Panel Inside Flap (all Cartons) (Bortezomib 13)

Principal Display Panel Inside Flap (all Cartons) (Bortezomib 13)
An instructional diagram for preparing Bortezomib for Injection by subcutaneous and intravenous routes. The left side details adding 1.4 mL of 0.9% sodium chloride to achieve 2.5 mg/mL concentration for subcutaneous injection. The right side shows adding 3.5 mL of 0.9% sodium chloride for a 1 mg/mL concentration for intravenous injection. Instructions include placing stickers on vials and syringes and referencing the package insert for full guidance.*

* About these descriptions: Image descriptions on this page are generated by automated AI analysis of the product label images from the manufacturer's FDA label submission (SPL). They are provided for reference only and may contain errors or omissions. Always rely on the printed label itself and the official FDA labeling, and consult a pharmacist or healthcare professional with any questions about this product.