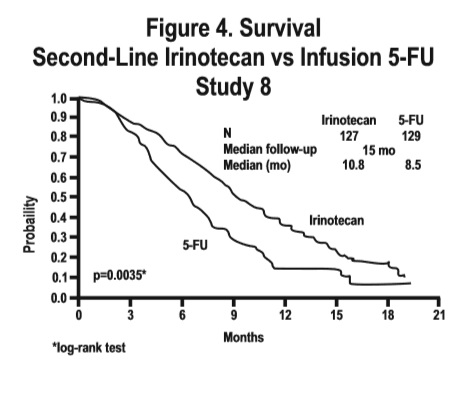
Image Description (Fig3)

This is a figure (Figure 3) showing survival probability for second-line treatment with Irinotecan compared to best supportive care in a study (Study 7). It includes data on the number of patients (N), median follow-up time in months, and median survival in months for both treatments. The *log-rank test was used.*