Docetaxel
Product Images NDC 72485-216

12 FDA label images from Armas Pharmaceuticals Inc. · Packaging, Regulatory Labels, and Product Appearance

Product Visual Gallery

This gallery contains 12 technical images submitted to the FDA as part of the official labeling for Docetaxel (NDC 72485-216). Unlike standard consumer photos, these assets often include clinical data figures, molecular chemical structures, and official manufacturer packaging layouts.

As provided by Armas Pharmaceuticals Inc., these visuals offer a comprehensive scientific overview of the product's physical and chemical identity, aiding pharmacists and researchers in product verification and study.

FDA Label Image

Image (767b6901 F1ec 4d39 Bc9f D808f2ec95a3 01)

Image (767b6901 F1ec 4d39 Bc9f D808f2ec95a3 01)
Chemical structure of Docetaxel showing its molecular framework with various functional groups and stereochemistry, representing the active ingredient in the product by Armas Pharmaceuticals Inc.*
FDA Label Image

Image (767b6901 F1ec 4d39 Bc9f D808f2ec95a3 02)

Image (767b6901 F1ec 4d39 Bc9f D808f2ec95a3 02)
A line graph showing disease-free survival (DFS) probability over time in months. The x-axis represents disease-free survival time (0 to 66 months), and the y-axis shows DFS probability percentage (0% to 100%). Two lines are compared: TAC and FAC, depicting their respective DFS probabilities throughout the timeline.*
FDA Label Image

Image (767b6901 F1ec 4d39 Bc9f D808f2ec95a3 03)

Image (767b6901 F1ec 4d39 Bc9f D808f2ec95a3 03)
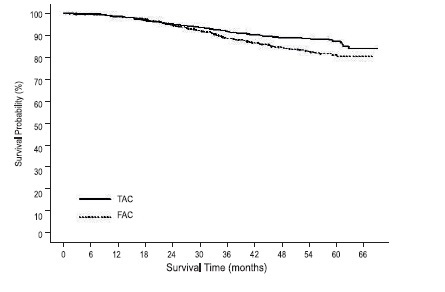
A Kaplan-Meier survival curve plot depicting survival probability (%) on the y-axis versus survival time in months on the x-axis. Two treatment groups are shown: TAC (solid line) and FAC (dotted line), illustrating differences in survival over a period up to 66 months.*
FDA Label Image

Image (767b6901 F1ec 4d39 Bc9f D808f2ec95a3 04)

Image (767b6901 F1ec 4d39 Bc9f D808f2ec95a3 04)
A Kaplan-Meier survival plot comparing cumulative survival probability over time in months for two groups labeled T75 and BSC. The graph includes a log-rank p-value indicating overall survival difference between groups.*
FDA Label Image

Image (767b6901 F1ec 4d39 Bc9f D808f2ec95a3 05)

Image (767b6901 F1ec 4d39 Bc9f D808f2ec95a3 05)
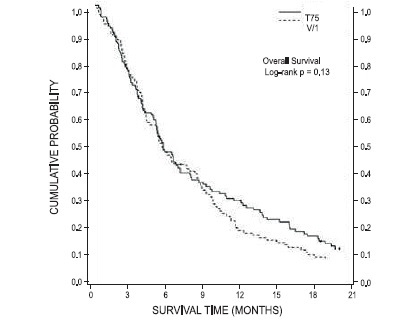
A Kaplan-Meier survival curve chart showing cumulative probability versus survival time in months. Two groups, labeled T75 and V/1, are compared for overall survival with a log-rank p-value of 0.13. The x-axis represents survival time from 0 to 21 months, and the y-axis represents cumulative probability from 0 to 1.0.*
FDA Label Image

Image (767b6901 F1ec 4d39 Bc9f D808f2ec95a3 06)

Image (767b6901 F1ec 4d39 Bc9f D808f2ec95a3 06)
A survival probability curve chart showing survival probability on the vertical axis and survival time in months on the horizontal axis, comparing two groups labeled T75 q3w and M q3w over a period up to 30 months.*
FDA Label Image

Image (767b6901 F1ec 4d39 Bc9f D808f2ec95a3 07)

Image (767b6901 F1ec 4d39 Bc9f D808f2ec95a3 07)
Kaplan-Meier survival curve graph comparing two groups labeled TFC and CF, showing probability percentage over time in months from 0 to 24. The graph depicts survival probability declining over time for both groups with TFC generally showing higher survival probability than CF.*
FDA Label Image

Image (767b6901 F1ec 4d39 Bc9f D808f2ec95a3 08)

Image (767b6901 F1ec 4d39 Bc9f D808f2ec95a3 08)
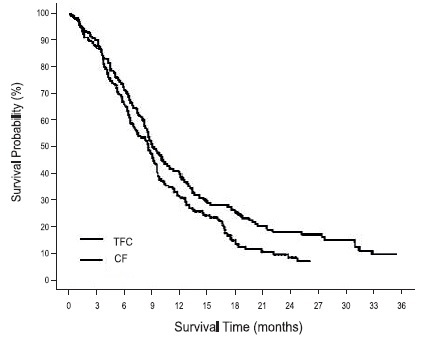
A survival curve chart comparing survival probability (%) over survival time in months for two groups labeled TFC and CF. The graph shows both curves declining over time, illustrating the decrease in survival probability for each group up to 36 months.*
FDA Label Image

Image (767b6901 F1ec 4d39 Bc9f D808f2ec95a3 09)

Image (767b6901 F1ec 4d39 Bc9f D808f2ec95a3 09)
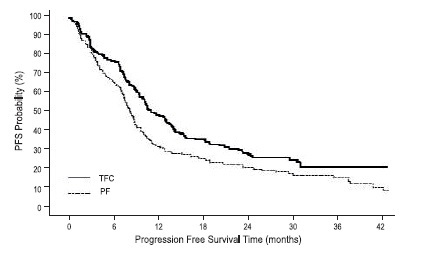
A line graph depicting progression-free survival (PFS) probability over time in months. Two curves are shown: a solid line labeled TFC and a dashed line labeled PF, illustrating their respective PFS probabilities across a 42-month period.*
FDA Label Image

Image (767b6901 F1ec 4d39 Bc9f D808f2ec95a3 10)

Image (767b6901 F1ec 4d39 Bc9f D808f2ec95a3 10)
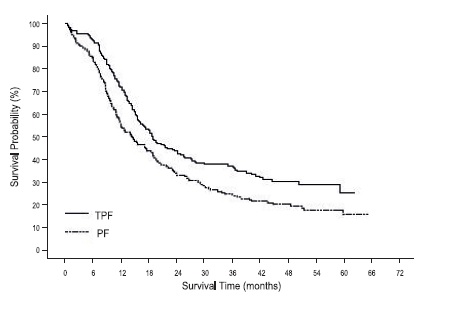
A survival probability graph comparing two treatment groups, labeled TPF and PF, over a survival time measured in months on the x-axis, with survival probability percentage on the y-axis. The plot shows survival decreasing over time for both groups, with TPF consistently showing a higher survival probability than PF throughout the 0 to 72-month period.*
FDA Label Image

Image (767b6901 F1ec 4d39 Bc9f D808f2ec95a3 11)

Image (767b6901 F1ec 4d39 Bc9f D808f2ec95a3 11)
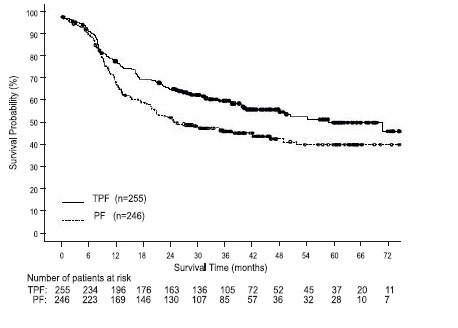
A Kaplan-Meier survival probability graph showing survival time in months on the horizontal axis and survival probability percentage on the vertical axis. The graph compares two groups labeled TPF (n=255) and PF (n=246), with corresponding lines representing survival trends over a 72-month period. Below the graph, a table lists the number of patients at risk at different time points for both groups.*
FDA Label Image

Doce160 (Label)

Doce160 (Label)
Packaging label for Docetaxel Injection, USP 160 mg/8 mL (20 mg/mL) by Armas Pharmaceuticals Inc. The label includes inner vial and outer carton designs with dosing details, warnings about cytotoxicity, usage instructions for intravenous infusion, and manufacturing information from Shilpa Medicare Limited, India. The vial and carton labels indicate a single-use 8 mL vial with a ready-to-add infusion solution.*

* About these descriptions: Image descriptions on this page are generated by automated AI analysis of the product label images from the manufacturer's FDA label submission (SPL). They are provided for reference only and may contain errors or omissions. Always rely on the printed label itself and the official FDA labeling, and consult a pharmacist or healthcare professional with any questions about this product.