Erlotinib Tablet, Film Coated
Product Images NDC 72485-218

View Photos of Packaging, Regulatory Labels, and Product Appearance

Product Visual Gallery

This gallery contains 6 technical images submitted to the FDA as part of the official labeling for Erlotinib (NDC 72485-218). Unlike standard consumer photos, these assets often include clinical data figures, molecular chemical structures, and official manufacturer packaging layouts.

As provided by Armas Pharmaceuticals Inc., these visuals offer a comprehensive scientific overview of the product's physical and chemical identity, aiding pharmacists and researchers in product verification and study.

FDA Label Image

Clin-1 (Cur 1)

Clin-1 (Cur 1)
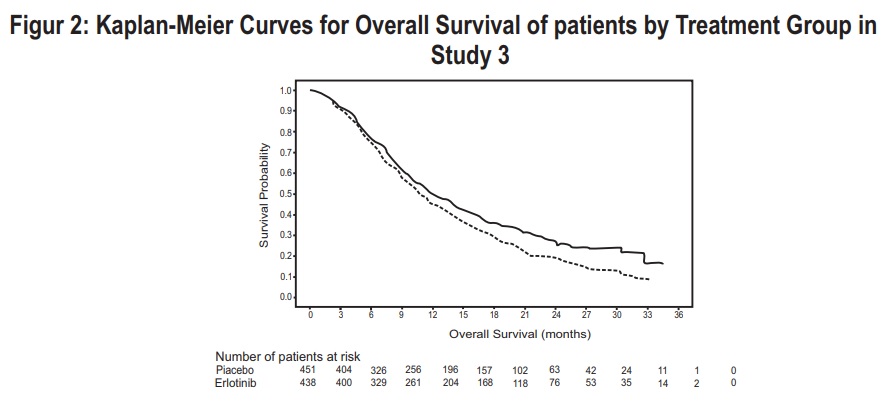
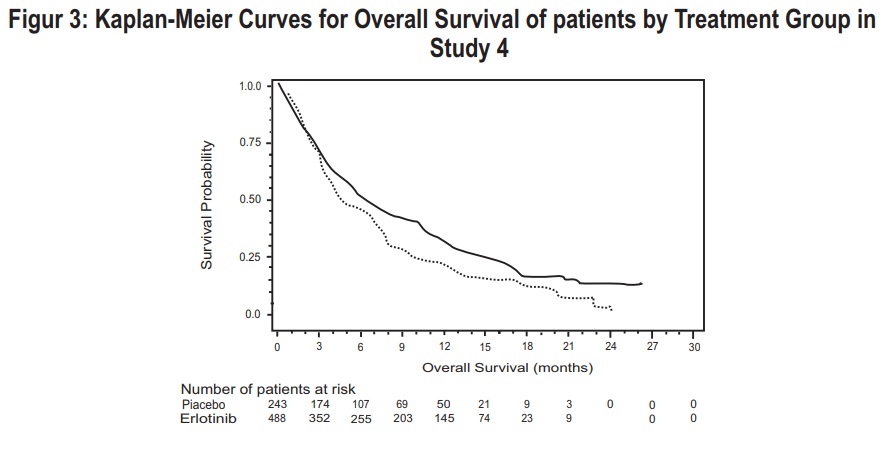
The text seems to be an image of a Kaplan-Meier curve from a study. It shows the progression-free survival probability over time, represented by the y-axis and duration of progression-free survival in months represented by the x-axis. Additionally, the number of patients at risk is listed in a table-like structure.*
FDA Label Image

Clin-2 (Cur 2)

Clin-2 (Cur 2)
The text is describing Figure 2 of Study 3, which shows the Kaplan-Meier curves depicting the overall survival of patients in different treatment groups. The x-axis of the graph represents the overall survival time (in months) while the y-axis represents the probability of survival. The number of patients at risk is also indicated on the x-axis. However, there is some inconsistency in the formatting of the text (e.g., "L T I R I I A"), making it difficult to interpret accurately.*
FDA Label Image

Cli-3 (Cur 3)

Cli-3 (Cur 3)
This is a Kaplan-Meier plot showing the overall survival probability of patients by treatment group in Study 4. The x-axis represents the overall survival in months, and the y-axis represents the probability of survival. The blue line represents the placebo group, and the orange line represents the eriotinib group. The number of patients at risk is shown below the x-axis.*
FDA Label Image

Clin-4 (Cur 4)

Clin-4 (Cur 4)
The description of the image is a Kaplan-Meier curve for overall survival, with a survival probability graph on the vertical axis and the overall survival time on the horizontal axis. It represents the cohort of 100 mg in study 5. The figure shows the number of patients at risk in the placebo and erlotinib groups.*
FDA Label Image

Er-des (Des 1)

FDA Label Image

Erlt-100 (Erl 100)

Erlt-100 (Erl 100)
This is a packaging label for Erlotinib Tablets manufactured by Shilpa Medicare Limited in India and distributed by Armas Pharmaceuticals in the USA. It provides information on usual dosage, storage, and manufacturing details; however, full prescribing information is available only in the enclosed package insert. Each film-coated tablet contains 100 mg of erlotinib free base, and storage at temperatures between 15-30°C (59°-86°F) is permitted. The NDC number for this product is 72485-218-30.*

* These product label images have been analyzed using experimental machine learning. Please verify findings with the primary label text.