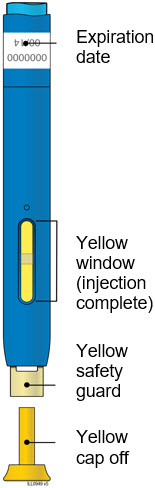
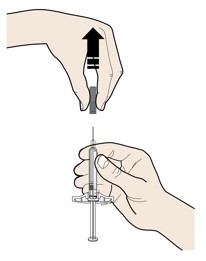
Figure 1 (Amjevita 01)

This looks like a graph showing a treatment plan for a medication, with the dose being 40mg given every other week and a placebo being given as well. The graph has numbers and symbols marking the weeks and medication doses. However, there is not enough context or details to fully understand the purpose or intended outcome of the treatment.*