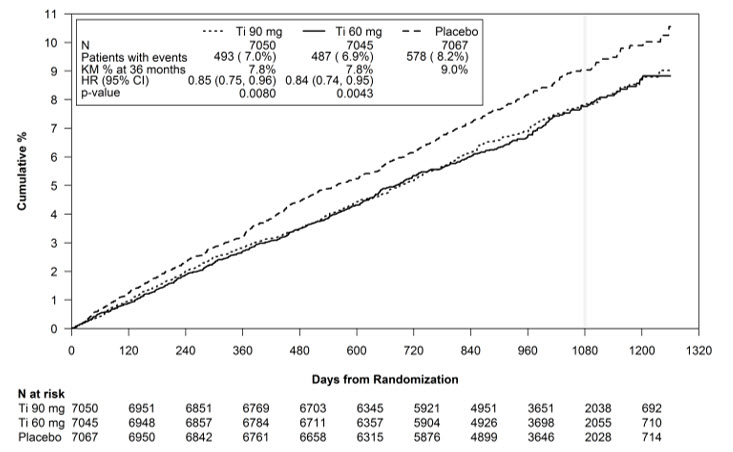
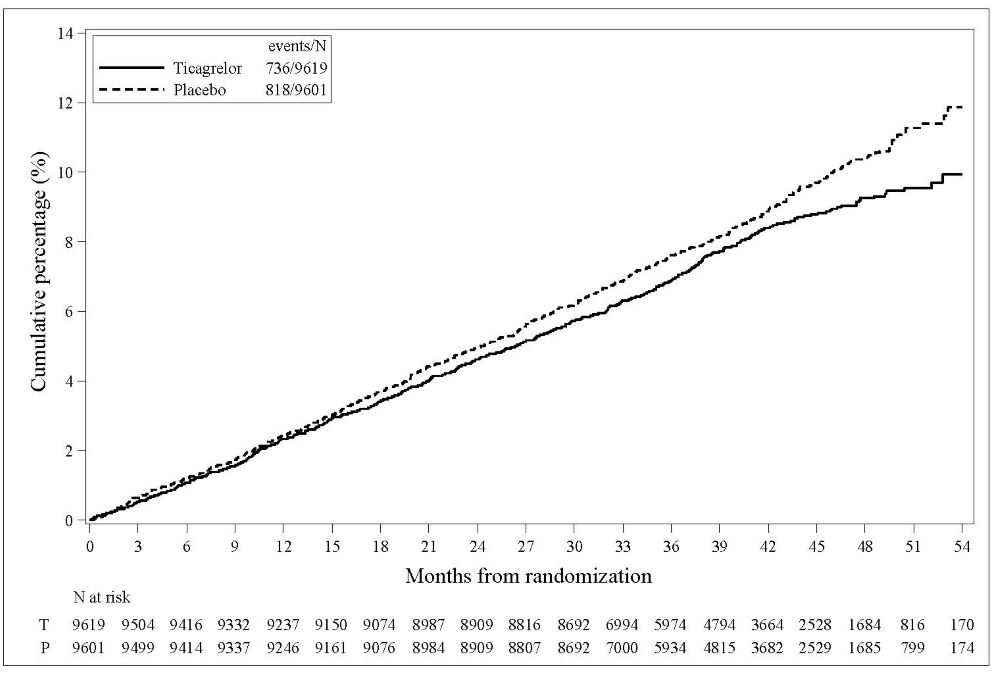
Product Images Ticagrelor

View Photos of Packaging, Labels & Appearance

Product Label Images

The following 22 images provide visual information about the product associated with Ticagrelor NDC 72516-018 by Oryza Pharmaceuticals, Inc., such as packaging, labeling, and the appearance of the drug itself. This resource could be helpful for medical professionals, pharmacists, and patients seeking to verify medication information and ensure they have the correct product.

figure_1 - Figure 1

figure_1 - Figure 1

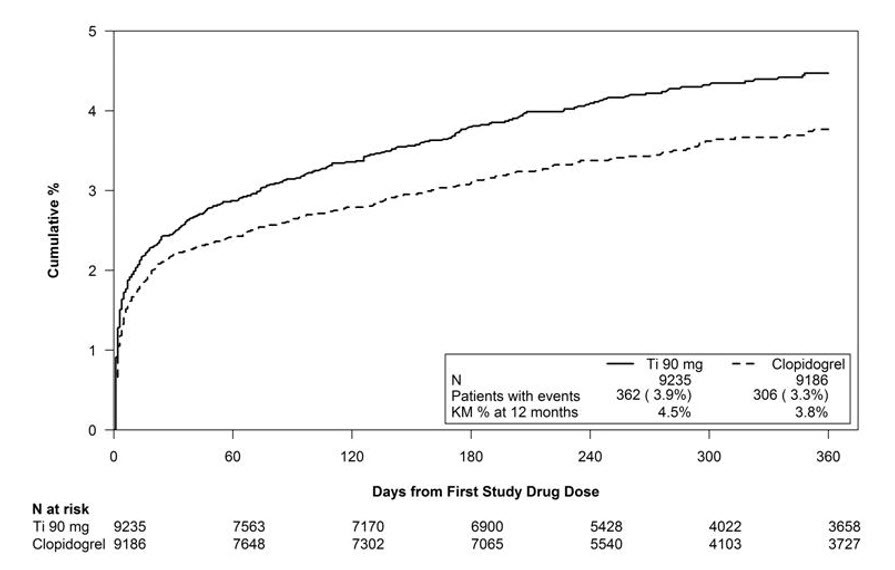
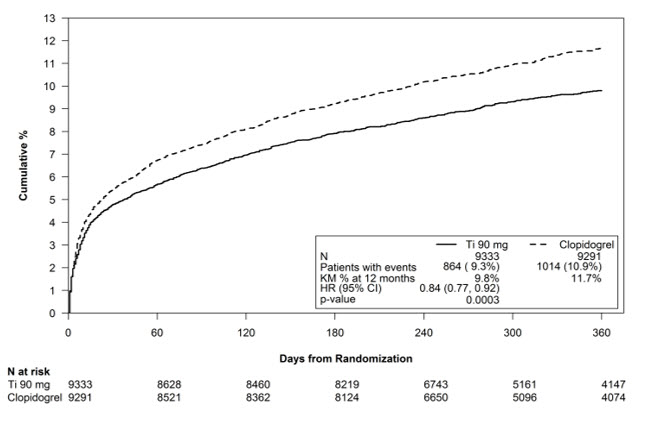
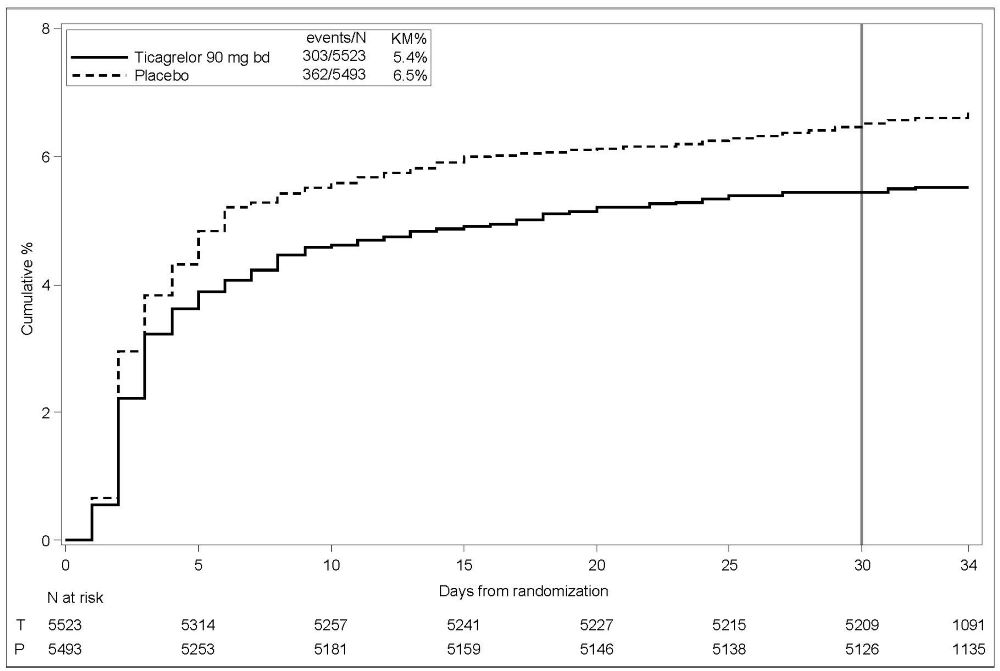
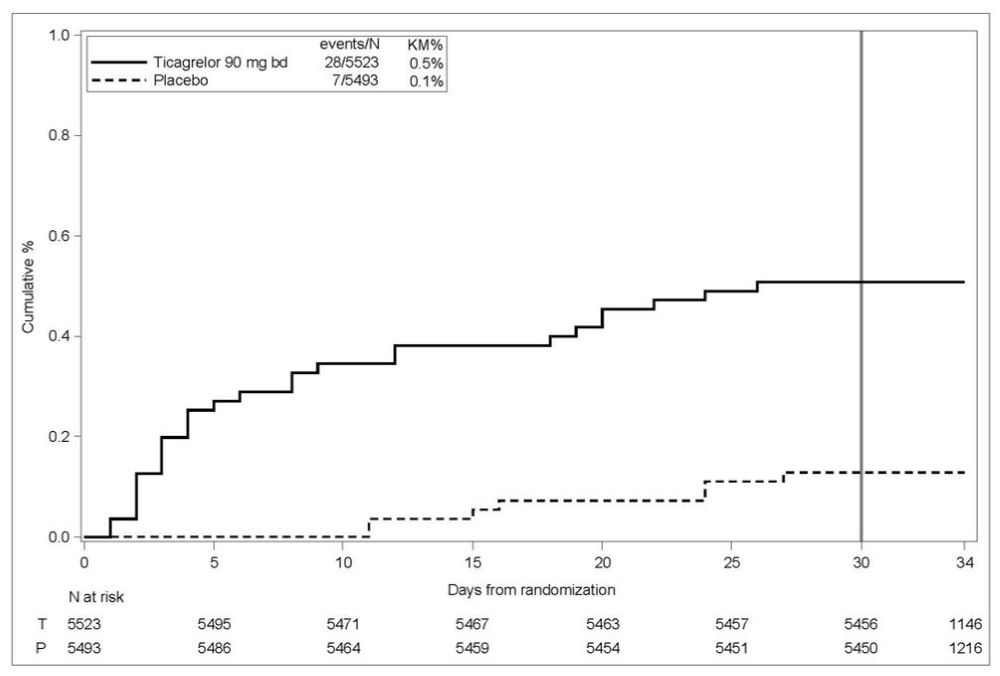
This text provides data on patients treated with Tigomg and Clopidogrel, showing the number of events among patients and the Kaplan-Meier percentage at 12 months for each treatment group. The text also displays the days from the first study drug dose and the number of patients at risk over time.*

fiigure_2 - Figure 2

fiigure_2 - Figure 2

chemical structure - chemical structure

chemical structure - chemical structure

figure_8 - figure 08

figure_8 - figure 08

This text appears to be a drug interaction recommendation guideline, providing information on the effects of ticagrelor (AR-C124910XX) when used in combination with different classes of drugs. It categorizes drugs as strong CYP3A4 inhibitors, moderate CYP3A inhibitors, potent CYP3A4 inducers, and P-gP and GYP3A inhibitors, giving recommendations on whether to avoid concomitant use, make dose adjustments, or use lower doses based on specific drugs. It also mentions certain drugs such as aspirin, desmopressin, heparin, enoxaparin, cyclosporine, morphine, and fentanyl, and provides details on their administration and dose adjustments.*

figure_10 - figure 10

figure_10 - figure 10

This is a comparison between two treatments, clopidogrel and another medication, in patients with certain events over a period of 12 months. The text appears to show the results of a study in terms of the number of patients and events for each treatment group over different time points following randomization. The data seems to include days from randomization and the number of events at each time point for both medications.*

figure_11 - figure 11

figure_11 - figure 11

figure_12 - figure 12

figure_12 - figure 12

figure_13 - figure 13

figure_13 - figure 13

figure_14 - figure 14

figure_14 - figure 14

Available data includes HR (Hazard Ratio) with 95% CI (Confidence Interval) values for various factors, treatment effects comparison, and patient characteristics. The data provides insights into different subgroups based on characteristics such as age, weight, ethnicity, medical history, and treatment regimen. It also includes information on the usage of Ticagrelor compared to Placebo in a study involving patients with Coronary Artery Disease. The HR values indicate the relative risk of events occurring in the Ticagrelor group compared to the Placebo group. This data can be analyzed to understand the impact of different variables on outcomes and treatment efficacy.*

figure_15 - figure 15

figure_15 - figure 15

This is an evaluation of cumulative percentages of events over time in a clinical study. The data includes the number of events for each time point and the total number of patients at risk. The study involves the comparison of two treatments: one labeled "Nat risk" and the other "Ticagrelor." The timeline is measured in months from randomization. The information provided is essential for analyzing the efficacy and safety of these treatments in the study population.*

figure_16 - figure 16

figure_16 - figure 16

This text provides a detailed analysis of various factors affecting the treatment efficacy of Ticagrelor compared to a placebo in different groups of patients. It includes information on patient characteristics such as age, sex, race, body mass index, geographic region, aspirin dose, and medical history including conditions like angina, diabetes, and smoking. The data presents Hazard Ratios (HR) with confidence intervals, showing how Ticagrelor performed compared to a placebo in different patient subgroups. These results are important for understanding the effectiveness of Ticagrelor in patients with different demographics and medical histories.*

figure_17 - figure 17

figure_17 - figure 17

The text provides data on the comparison between ticagrelor 90 mg twice per day and placebo in a clinical trial. The number of events for ticagrelor was 303 out of 5523 (5.4%) and for placebo, it was 362 out of 5493 (6.5%). The N values at risk for both groups are shown over time from randomization.*

figure_18 - figure 18

figure_18 - figure 18

This data provides information on a clinical trial's patient demographics, including age distribution, sex ratio, race, weight distribution, geographic regions, and medical history related to diagnoses such as stroke, TIA, diabetes, hypertension, prior ischemic events, smoking status, and cardiovascular conditions. The text also includes statistics comparing the efficacy of Ticagrelor versus Placebo in the study, measured by various health indicators.*

figure_3 - figure 3

figure_3 - figure 3

This data appears to show the number of participants at risk over time in a study evaluating the use of Ticagrelor (206/9562) versus Placebo (100/9531) in a certain event. The table shows the cumulative percentage over months from randomization. This information can provide insights into the progression of the study and the number of participants left at each time point.*

figure_4 - figure 4

figure_4 - figure 4

This data table shows the cumulative percentage of events for two groups receiving different treatments, Ticagrelor 90 mg and Placebo, in a study. The events are measured against the number of observed events and the total number of patients at risk. The table also provides the number of days from randomization for each group.*

figure_5 - figure 5

figure_5 - figure 5

figure_6 - figure 6

figure_6 - figure 6

figure_7 - figure 7

figure_7 - figure 7

This text provides information on the recommended dose adjustments for ticagrelor (AR-C124910XX) based on different intrinsic factors such as age, gender, ethnicity, renal impairment, hepatic impairment, and end-stage renal disease. It mentions that no dose adjustment is needed for most of the intrinsic factors considered. It also mentions specific conditions where ticagrelor has not been studied or where single doses should be administered with caution.*

figure_9 - image 09

figure_9 - image 09

This text provides information about the interaction of Ticagrelor with various drugs. It lists different drugs along with their doses and whether any dose adjustment is recommended when used in combination with Ticagrelor. The text suggests the changes in effect and confidence intervals when Ticagrelor interacts with different drugs, such as Simvastatin, Amlodipine, Levonorgestrel, Estradiol, Torsemide, Digoxin, and Cyclosporine. It provides specific recommendations for dose adjustments based on the combination used.*

90 mg 60 count label - image 90

90 mg 60 count label - image 90

Each tablet contains 90 mg of ticagrelor. This medication is typically prescribed to adults, with dosage instructions available in the package insert. It is important to store the tablets in a safe place away from children and at a temperature between 20° to 25°C (68° to 77°F). This particular brand is distributed by Oryza Pharmaceuticals, Inc. and manufactured by Sunshine Lake Pharma Co., Ltd in Guangdong Province. Remember to provide each patient with the accompanying Medication Guide.*

Logo - logo0001 01

Logo - logo0001 01

logo0001-02 - logo0001 02

logo0001-02 - logo0001 02

* The product label images have been analyzed using a combination of traditional computing and machine learning techniques. It should be noted that the descriptions provided may not be entirely accurate as they are experimental in nature. Use the information in this page at your own discretion and risk.