Tamsulosin Hydrochloride Capsule
Product Images NDC 72603-115

View Photos of Packaging, Regulatory Labels, and Product Appearance

Product Visual Gallery

This gallery contains 7 technical images submitted to the FDA as part of the official labeling for Tamsulosin Hydrochloride (NDC 72603-115). Unlike standard consumer photos, these assets often include clinical data figures, molecular chemical structures, and official manufacturer packaging layouts.

As provided by Northstar Rx Llc, these visuals offer a comprehensive scientific overview of the product's physical and chemical identity, aiding pharmacists and researchers in product verification and study.

FDA Label Image

Figure (Tamsulosin Fig1)

Figure (Tamsulosin Fig1)
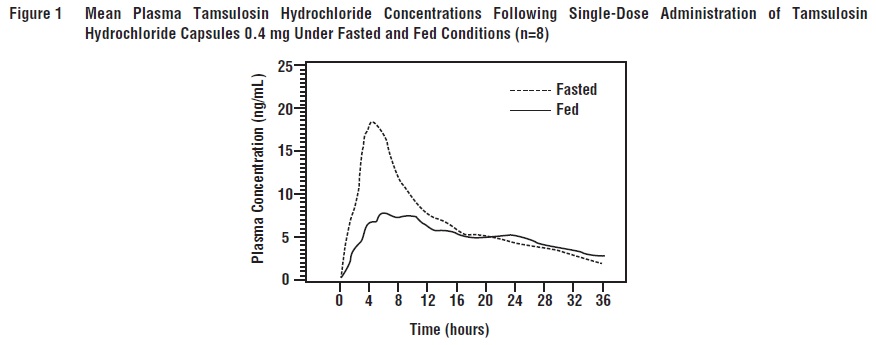
This text describes a graph, labeled as Figure 1, which shows the mean plasma concentrations of Tamsulosin Hydrochloride following the administration of Tamsulosin Hydrochloride Capsules at a dose of 0.4 mg under both fasted and fed conditions. The graph shows the plasma concentrations over time, with time marked in hours and the plasma concentration in ng/mL. The graph has two lines, one for the fasted state and one for the fed state, and is based on data obtained from a sample size of 8 individuals.*
FDA Label Image

Figure (Tamsulosin Fig2)

FDA Label Image

Figure (Tamsulosin Fig3)

Figure (Tamsulosin Fig3)
This is a graph showing the mean change from baseline in Total AUA Symptom Score (0 to 35) for two different treatments. One treatment is shown as "00008my_ -A-/s-A0.4mg" and the other is "Placebo". The graph shows the mean change at various time points during the study, with the x-axis showing the duration of treatment in weeks.*
FDA Label Image

Figure (Tamsulosin Fig4)

Figure (Tamsulosin Fig4)
This is a statistical summary of a study that evaluated the mean increase in peak urine flow rate in ml/sec. The study had two treatment groups: one received 2.54 mg of a medication (with an unclear name due to errors) while the other received a placebo. The study lasted for 13 weeks and involved 154 participants. The results show that the group that received the medication had a higher increase in peak urine flow rate (3.09 mL/sec) compared to the placebo group (2.04 mL/sec). The mean change in urine flow rate was 1.04 musec.*
FDA Label Image

Figure (Tamsulosin Fig5)

Figure (Tamsulosin Fig5)
The text shows a figure labeled as 3B representing a study involving two treatments: 0.8 mg-A-A-0.4 mpTrCY and Placebo. It also displays the mean increase in peak urine flow rate measured in mL/Sec. The study had a duration of weeks and had several participants (n) in different groups depending on the treatment. There is also a chart showing the Mean Change over time. However, the data seems incomplete and specific details about the study are not available.*
FDA Label Image

Package Label-principal Display Panel (0.4 mg (100 Capsules Bottle))

Package Label-principal Display Panel (0.4 mg (100 Capsules Bottle))
Each capsule contains 0.4mg of Tamsulosin hydrochloride USP. They are manufactured by Northstar Rx LLC and should be stored at 20° to 25°C. The usual dosage should be obtained from the accompanying prescribing information. The capsules should be kept away from excessive moisture and dispensed in a tight container. The M.L. number is 22/MN/AP/2009/F/R and they come in a pack of 100 capsules. The product is from India and the expiry date and lot number are located in the coding area.*
FDA Label Image

Chemical Structure (Tamsulosin Str)

* These product label images have been analyzed using experimental machine learning. Please verify findings with the primary label text.