Figure1 (Figure1)
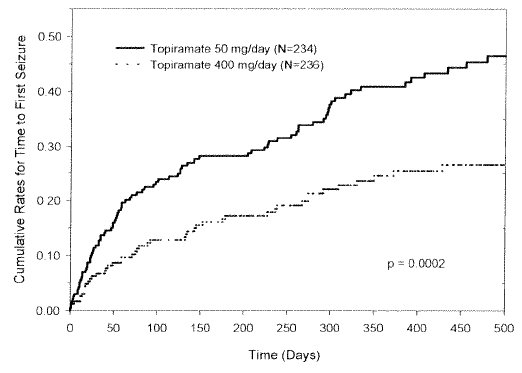
This is a graph showing Cumulative Rates of Time to First Seizure for two different doses of Topiramate, a medication used to treat seizures. One group took a 50mg dose daily and the other group took a 400mg dose daily. The graph displays the percentage of patients still experiencing a first seizure over time, with the X-axis representing the number of days and the Y-axis representing the percentage of patients.*