Image (48937761 7d65 4ac1 B884 Bfb73099da73 01)
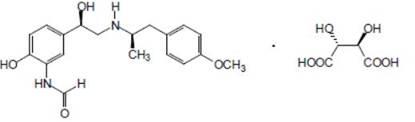
This gallery contains 12 technical images submitted to the FDA as part of the official labeling for Arformoterol Tartrate (NDC 72603-208). Unlike standard consumer photos, these assets often include clinical data figures, molecular chemical structures, and official manufacturer packaging layouts.
As provided by Northstar Rxllc, these visuals offer a comprehensive scientific overview of the product's physical and chemical identity, aiding pharmacists and researchers in product verification and study.


* These product label images have been analyzed using experimental machine learning. Please verify findings with the primary label text.