Pirfenidone Tablet, Film Coated
Product Images NDC 72603-259

View Photos of Packaging, Regulatory Labels, and Product Appearance

Product Visual Gallery

This gallery contains 7 technical images submitted to the FDA as part of the official labeling for Pirfenidone (NDC 72603-259). Unlike standard consumer photos, these assets often include clinical data figures, molecular chemical structures, and official manufacturer packaging layouts.

As provided by Northstar Rx Llc, these visuals offer a comprehensive scientific overview of the product's physical and chemical identity, aiding pharmacists and researchers in product verification and study.

FDA Label Image

Pirfenidone-267mg-270s-carton-lbl.jpg (Pirfenidone 267mg 270s Carton Lbl)

Pirfenidone-267mg-270s-carton-lbl.jpg (Pirfenidone 267mg 270s Carton Lbl)
Packaging label for Pirfenidone Tablets 267 mg, film-coated oral tablets, labeled for Northstar Rx LLC. The box contains 270 tablets, divided into 3 bottles of 90 tablets each. The label includes storage instructions and manufacturer information, noting manufacture by MSN Laboratories Private Limited in India.*
FDA Label Image

Pirfenidone-267mg-90s-cont-lbl.jpg (Pirfenidone 267mg 90s Cont Lbl)

Pirfenidone-267mg-90s-cont-lbl.jpg (Pirfenidone 267mg 90s Cont Lbl)
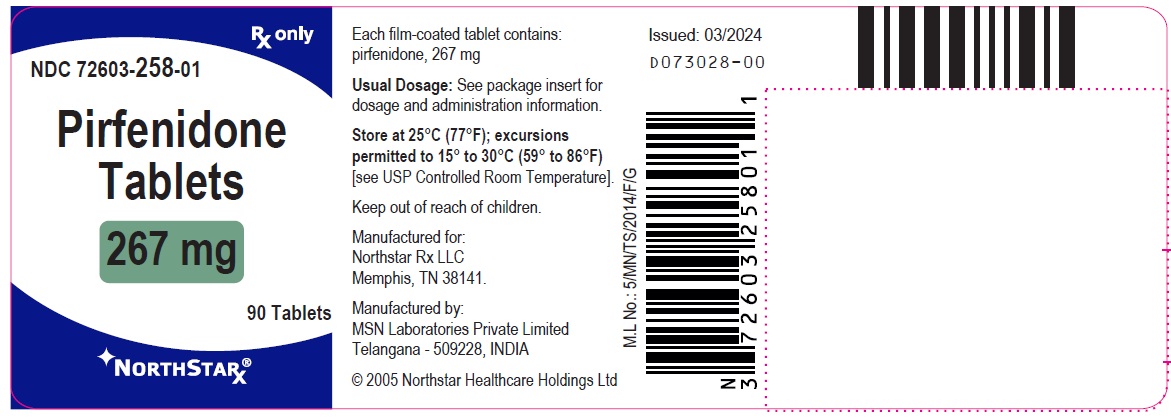
Pirfenidone Tablets 267 mg film-coated oral tablets label showing 90 tablets per bottle. Manufactured for Northstar Rx LLC and by MSN Laboratories Private Limited, India. Storage instructions at controlled room temperature and usual dosage information are noted. Label includes barcodes and the Northstar logo.*
FDA Label Image

Pirfenidone-801mg-90s-cont-lbl.jpg (Pirfenidone 801mg 90s Cont Lbl)

Pirfenidone-801mg-90s-cont-lbl.jpg (Pirfenidone 801mg 90s Cont Lbl)
Pirfenidone Tablets 801 mg film-coated oral tablets label from Northstar Rx LLC. The label indicates 90 tablets per package, manufactured by MSN Laboratories in India. Storage instructions specify 25°C with permitted excursions. Barcodes and NDC 72603-259-01 are shown on the label.*
FDA Label Image

Fig1 (Pirfenidone Figure 1)

Fig1 (Pirfenidone Figure 1)
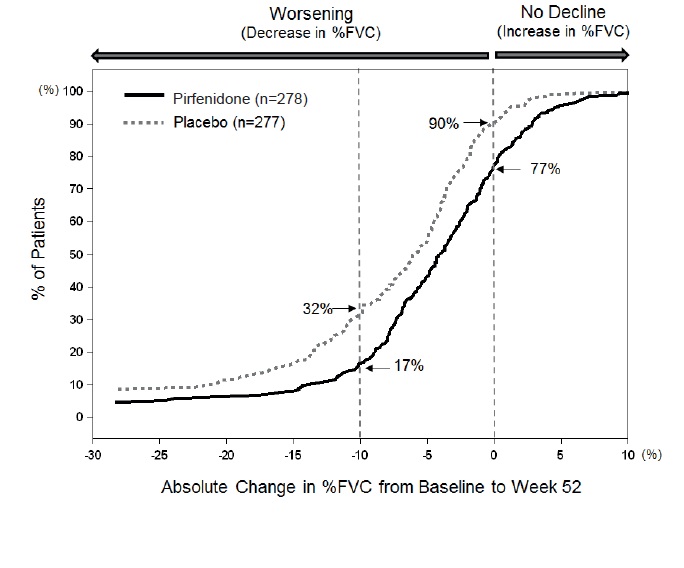
A cumulative distribution line graph showing the percentage of patients versus absolute change in percentage predicted FVC from baseline to week 52. The graph compares two groups: Pirfenidone (n=278) represented by a solid line, and placebo (n=277) represented by a dotted line. The x-axis ranges from -30% to 10% change in FVC with markers indicating worsening (decrease) to no decline (increase). Key points highlight 17% and 77% for the Pirfenidone group and 32% and 90% for the placebo group around -10% and 0% change respectively.*
FDA Label Image

Fig2 (Pirfenidone Figure 2)

Fig2 (Pirfenidone Figure 2)
A line graph showing mean change in FVC (mL) over 52 weeks comparing Pirfenidone and placebo groups. The x-axis represents weeks (0, 13, 26, 39, 52) and the y-axis shows mean change in FVC in mL, from 0 to -500. Pirfenidone group (n=278) shows a less steep decline in FVC compared to the placebo group (n=277) over time.*
FDA Label Image

Fig3 (Pirfenidone Figure 3)

Fig3 (Pirfenidone Figure 3)
A survival curve chart comparing the percentage of patients alive over time in weeks between Pirfenidone (n=623) and placebo (n=624) groups. The graph plots patient survival from 0 to 120 weeks and includes a hazard ratio with 95% confidence intervals. Number of patients at risk is shown below the time axis for both groups.*
FDA Label Image

Str (Pirfenidone Str)

Str (Pirfenidone Str)
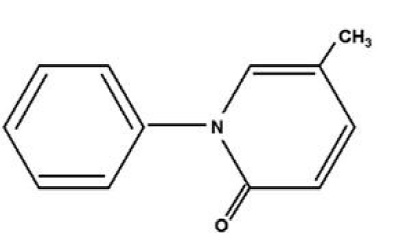
Chemical structure of pirfenidone, showing a pyridone ring with a methyl group and connected to a phenyl ring via a nitrogen atom.*

* About these descriptions: Image descriptions on this page are generated by automated AI analysis of the product label images from the manufacturer's FDA label submission (SPL). They are provided for reference only and may contain errors or omissions. Always rely on the printed label itself and the official FDA labeling, and consult a pharmacist or healthcare professional with any questions about this product.