Sevelamer Carbonate Powder, For Suspension
Product Images NDC 72603-398

View Photos of Packaging, Regulatory Labels, and Product Appearance

Product Visual Gallery

This gallery contains 6 technical images submitted to the FDA as part of the official labeling for Sevelamer Carbonate (NDC 72603-398). Unlike standard consumer photos, these assets often include clinical data figures, molecular chemical structures, and official manufacturer packaging layouts.

As provided by Northstar Rxllc, these visuals offer a comprehensive scientific overview of the product's physical and chemical identity, aiding pharmacists and researchers in product verification and study.

FDA Label Image

333 (Sevelamer Carbonate Suspension Carton 90 Packets)

333 (Sevelamer Carbonate Suspension Carton 90 Packets)
SEVELAMER CARBONATE 0.8 g powder for oral suspension in packets, citrus flavor, by NorthStar RxLLC. The label shows that the package contains 90 packets. It includes typical patient instructions on preparation and storage, and indicates the product is manufactured for NorthStar Rx LLC, Memphis, TN. The label features blue, white, and orange design elements and contains barcodes and lot details.*
FDA Label Image

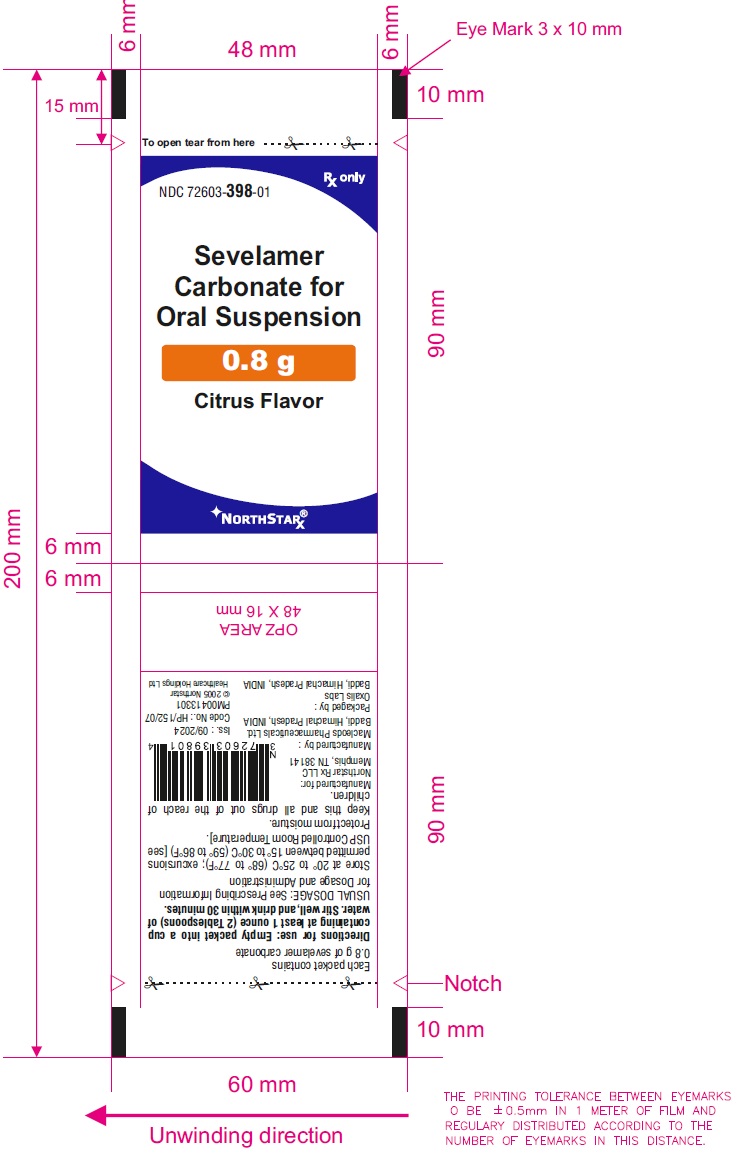
222 (Sevelamer Carbonate Suspension Foil Label)

222 (Sevelamer Carbonate Suspension Foil Label)
Label for SEVELAMER CARBONATE 0.8 g powder for oral suspension, citrus flavor, by NorthStar RxLLC. The label includes the NDC 72603-398-01, branding Elements including a blue curved design and the NorthStar logo, an Rx only indicator, and detailed directions for use and storage instructions printed inversely on the lower half of the label.*
FDA Label Image

Str (Sevelamer Figure 1)

Str (Sevelamer Figure 1)
Chemical structure diagram of sevelamer carbonate, showing the polymeric arrangement of its molecular components with ammonium and bicarbonate groups and multiple amine and hydroxyl functional groups.*
FDA Label Image

Fig-2 (Sevelamer Figure 2)

Fig-2 (Sevelamer Figure 2)
A forest plot showing subgroup analyses with mean differences and 95% confidence intervals comparing Sevelamer Carbonate and placebo. Subgroups include screening BSA, baseline serum phosphorus levels, age groups, and dialysis status, with markers indicating the favored treatment for each subgroup.*
FDA Label Image

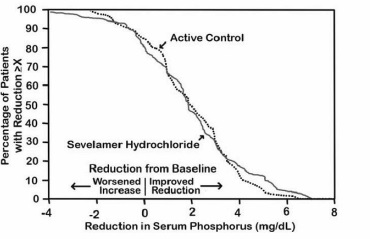
Fig-1 (Sevelamer Figure 3)

Fig-1 (Sevelamer Figure 3)
A line graph comparing percentage of patients with reduction in serum phosphorus for Sevelamer Hydrochloride versus an active control. The x-axis represents reduction in serum phosphorus (mg/dL), ranging from -4 to 8, and the y-axis shows percentage of patients with reduction, ranging from 0 to 100. It indicates reduction from baseline with directions for increase and improved reduction.*
FDA Label Image

Fig-4 (Sevelamer Figure 4)

Fig-4 (Sevelamer Figure 4)
A line graph showing phosphorus change from baseline over a 52-week study period. It compares two groups: one using Sevelamer Hydrochloride and an Active-Control group, with phosphorus levels plotted on the vertical axis and study weeks on the horizontal axis.*

* About these descriptions: Image descriptions on this page are generated by automated AI analysis of the product label images from the manufacturer's FDA label submission (SPL). They are provided for reference only and may contain errors or omissions. Always rely on the printed label itself and the official FDA labeling, and consult a pharmacist or healthcare professional with any questions about this product.