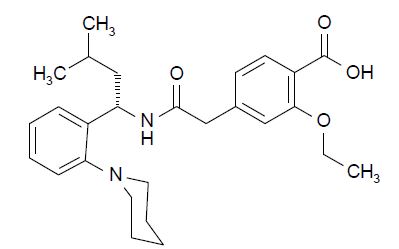
505 (Repaglinide Figure 1)

This text seems to display a comparison between different treatments or drugs related to Pioglitazone in terms of their impact on HbA1c levels over time. The graph shows a pattern of change in HbA1c (%) over treatment weeks. It appears to represent the effectiveness or differences between the mentioned treatments.*