Dofetilide
Product Images NDC 72664-229

View Photos of Packaging, Regulatory Labels, and Product Appearance

Product Visual Gallery

This gallery contains 10 technical images submitted to the FDA as part of the official labeling for Dofetilide (NDC 72664-229). Unlike standard consumer photos, these assets often include clinical data figures, molecular chemical structures, and official manufacturer packaging layouts.

As provided by Vgyaan Pharmaceuticals Llc, these visuals offer a comprehensive scientific overview of the product's physical and chemical identity, aiding pharmacists and researchers in product verification and study.

FDA Label Image

Chemicalstructure (Chemicalstructure)

Chemicalstructure (Chemicalstructure)
Chemical structure of the active ingredient Dofetilide, showing its molecular connections including aromatic rings and functional groups such as methylsulfonamide and methanesulfonamide substituents.*
FDA Label Image

Container-label125mcg (Container Label125mcg)

Container-label125mcg (Container Label125mcg)
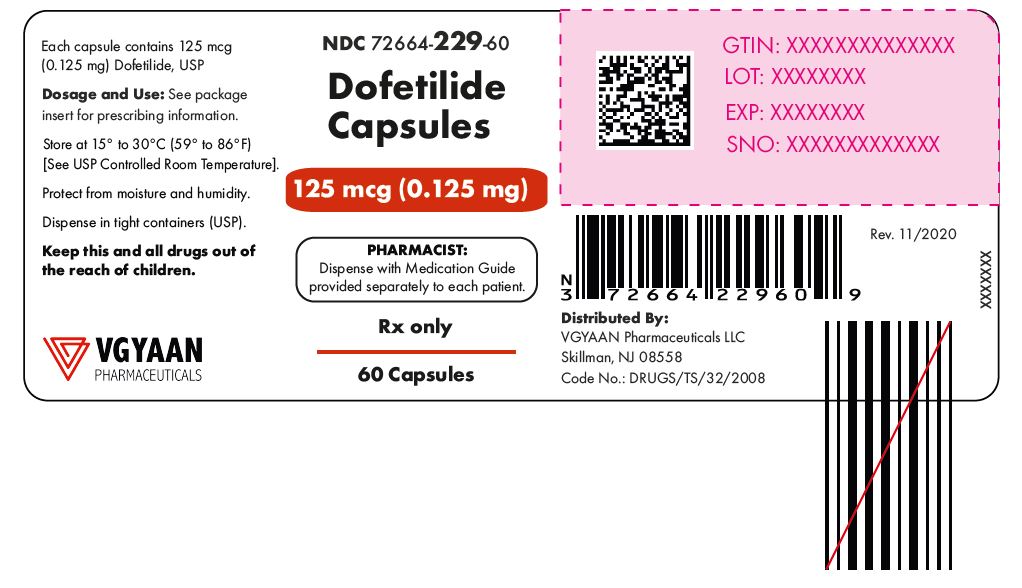
Label for Dofetilide Capsules 125 mcg (0.125 mg) by VGYAAN Pharmaceuticals LLC, containing 60 capsules. The label includes storage instructions, a warning to keep out of reach of children, and states the product is Rx only. It features NDC 72664-229-60 and distribution details from VGYAAN Pharmaceuticals in Skillman, NJ.*
FDA Label Image

Container-label250mcg (Container Label250mcg)

Container-label250mcg (Container Label250mcg)
Dofetilide Capsules 250 mcg (0.25 mg) label from VGYAAN Pharmaceuticals LLC. The label indicates the product contains 60 capsules, with storage instructions and dosage guidance referencing a package insert. It includes barcodes, a QR code, and warnings to keep the drug out of reach of children. The label also states 'Rx only' for prescription use.*
FDA Label Image

Container-label500mcg (Container Label500mcg)

Container-label500mcg (Container Label500mcg)
Label for Dofetilide capsules 500 mcg (0.5 mg) by VGYAAN Pharmaceuticals LLC. The label shows dosage form as capsules, package count of 60 capsules, and includes storage instructions and a pharmacist note to dispense with medication guide. It displays an NDC number, barcodes, and various regulatory details.*
FDA Label Image

Figure1 (Figure1)

Figure1 (Figure1)
A scatter plot showing the mean change from baseline QTc interval (msec) on the vertical axis versus mean plasma dofetilide concentration (ng/mL) on the horizontal axis. Data points for Day 1 and Day 23 (steady state) are indicated with different markers and fitted trend lines show their relationships.*
FDA Label Image

Figure2 (Figure2)

Figure2 (Figure2)
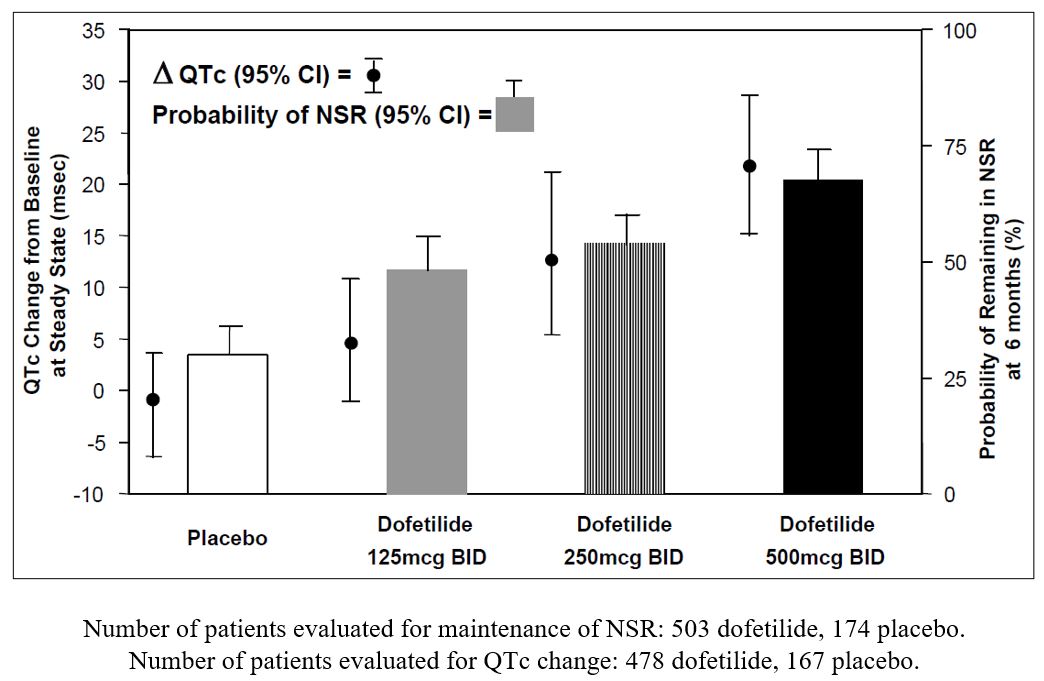
A bar graph presenting the effects of dofetilide at doses of 125 mcg BID, 250 mcg BID, and 500 mcg BID, compared with placebo. The left y-axis represents QTc change from baseline (in milliseconds) at steady state, shown as bars with 95% confidence intervals, and the right y-axis shows the probability of remaining in normal sinus rhythm (NSR) at 6 months (percentage), depicted by symbols with 95% confidence intervals. The graph includes patient numbers evaluated for maintenance of NSR and QTc change.*
FDA Label Image

Figure3 (Figure3)

Figure3 (Figure3)
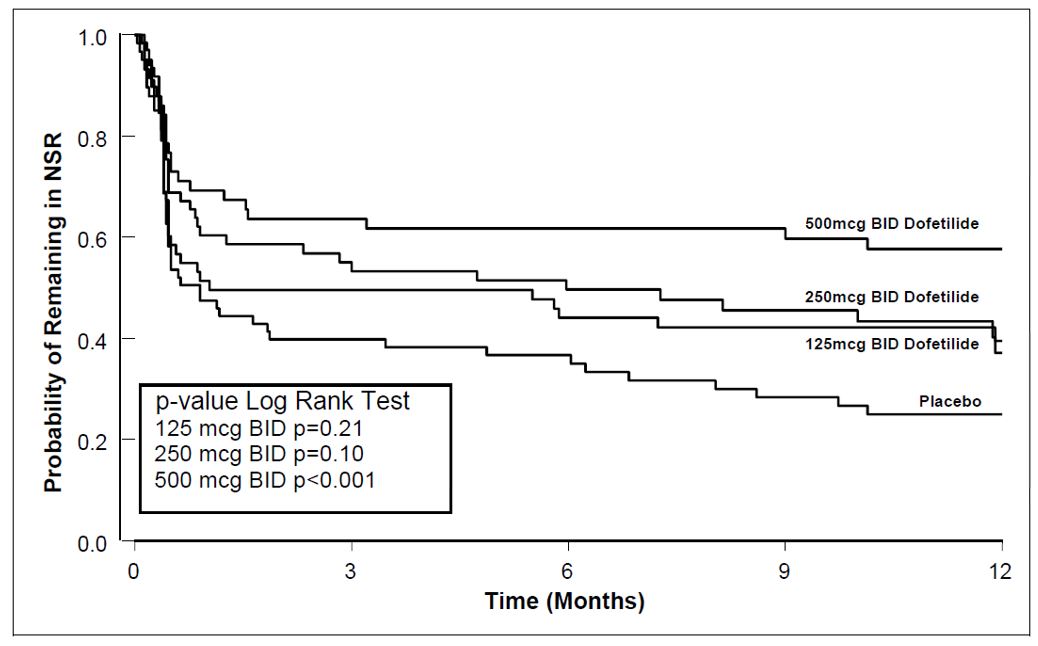
A Kaplan-Meier survival curve chart illustrating the probability of remaining in normal sinus rhythm (NSR) over 12 months. The chart compares four groups: 125 mcg BID Dofetilide, 250 mcg BID Dofetilide, 500 mcg BID Dofetilide, and placebo. The x-axis represents time in months, and the y-axis shows the probability of remaining in NSR. Statistical p-values from a Log Rank Test are noted for each dosage group.*
FDA Label Image

Figure4 (Figure4)

Figure4 (Figure4)
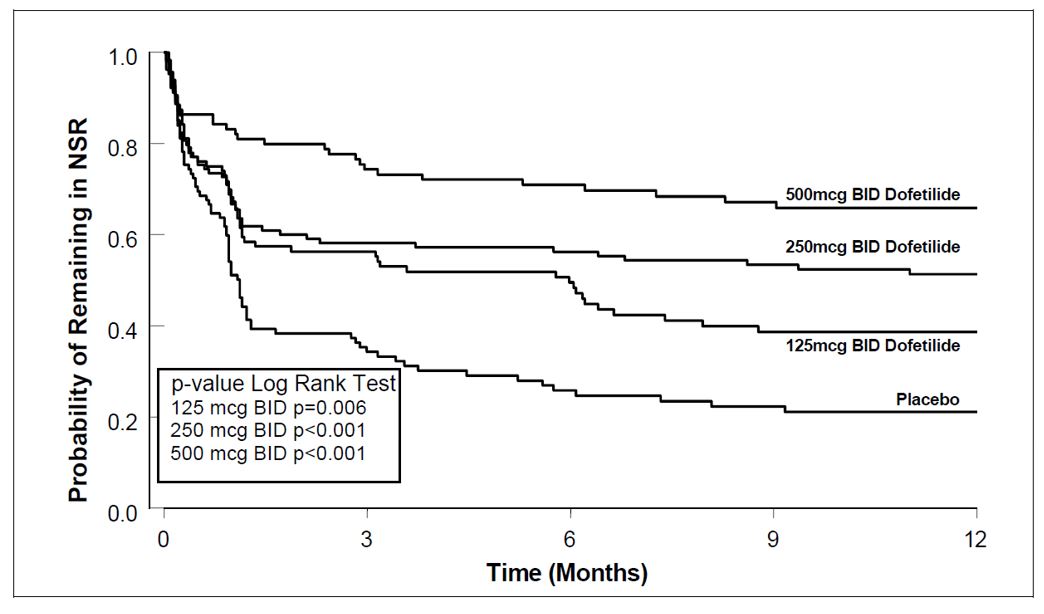
A Kaplan-Meier plot showing the probability of remaining in NSR (normal sinus rhythm) over a 12-month period for Dofetilide at doses of 125 mcg, 250 mcg, and 500 mcg taken twice daily (BID) compared to placebo. The y-axis represents the probability of remaining in NSR, while the x-axis represents time in months. Dose-dependent curves indicate higher probabilities at increased dosages of Dofetilide.*
FDA Label Image

Figure5 (Figure5)

Figure5 (Figure5)
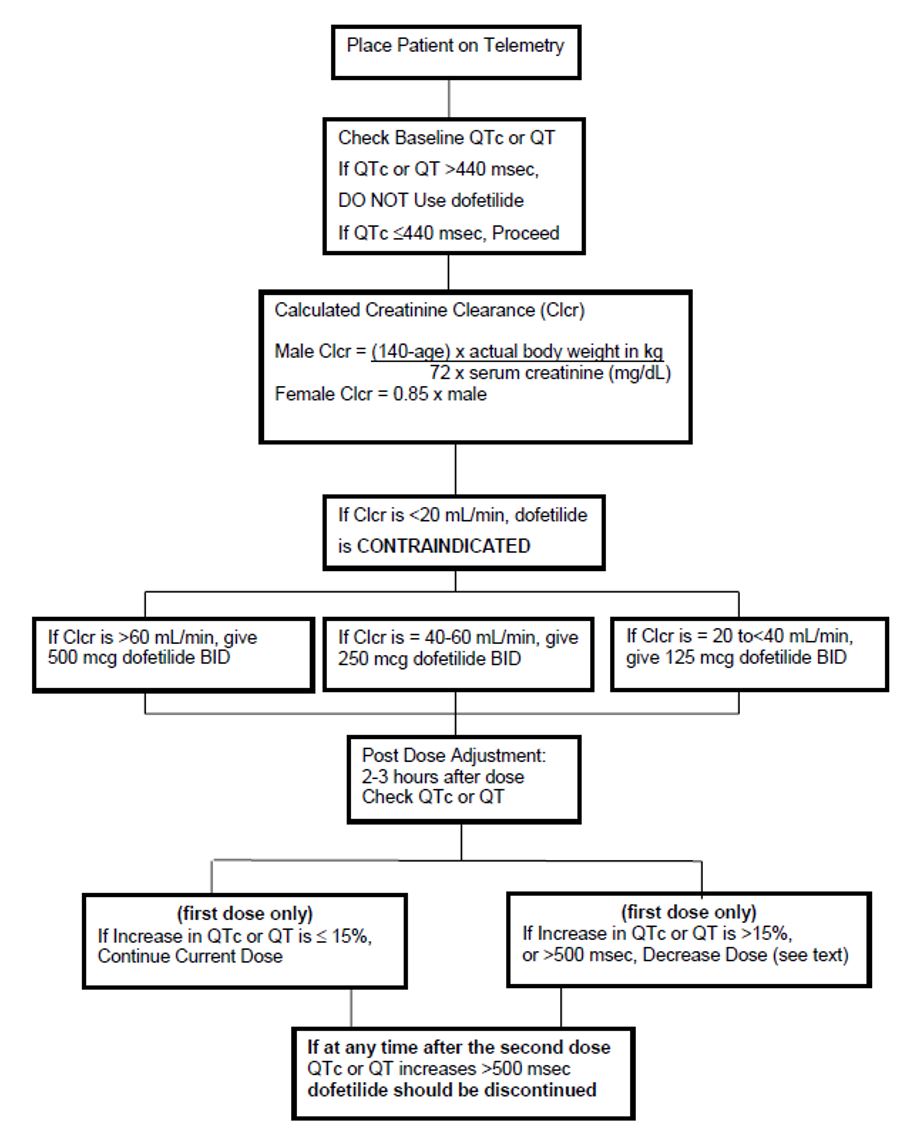
A flowchart illustrating dosing and monitoring guidelines for dofetilide. It starts with placing the patient on telemetry followed by checking baseline QTc or QT intervals. It includes formulas for calculating creatinine clearance in males and females, dosing recommendations based on creatinine clearance, post-dose QTc or QT monitoring instructions, and criteria for dose continuation, adjustment, or discontinuation based on QTc or QT changes.*
FDA Label Image

Figure6 (Figure6)

Figure6 (Figure6)
This image shows mathematical formulas for calculating creatinine clearance in males and females. The formulas use age, actual body weight in kilograms, and serum creatinine in mg/dL, with an adjustment factor of 0.85 for females.*

* About these descriptions: Image descriptions on this page are generated by automated AI analysis of the product label images from the manufacturer's FDA label submission (SPL). They are provided for reference only and may contain errors or omissions. Always rely on the printed label itself and the official FDA labeling, and consult a pharmacist or healthcare professional with any questions about this product.