Silodosin Capsule
Product Images NDC 72789-090

7 FDA label images from Pd-rx Pharmaceuticals, Inc. · Packaging, Regulatory Labels, and Product Appearance

Product Visual Gallery

This gallery contains 7 technical images submitted to the FDA as part of the official labeling for Silodosin (NDC 72789-090). Unlike standard consumer photos, these assets often include clinical data figures, molecular chemical structures, and official manufacturer packaging layouts.

As provided by Pd-rx Pharmaceuticals, Inc., these visuals offer a comprehensive scientific overview of the product's physical and chemical identity, aiding pharmacists and researchers in product verification and study.

FDA Label Image

72789090 Label (72789090)
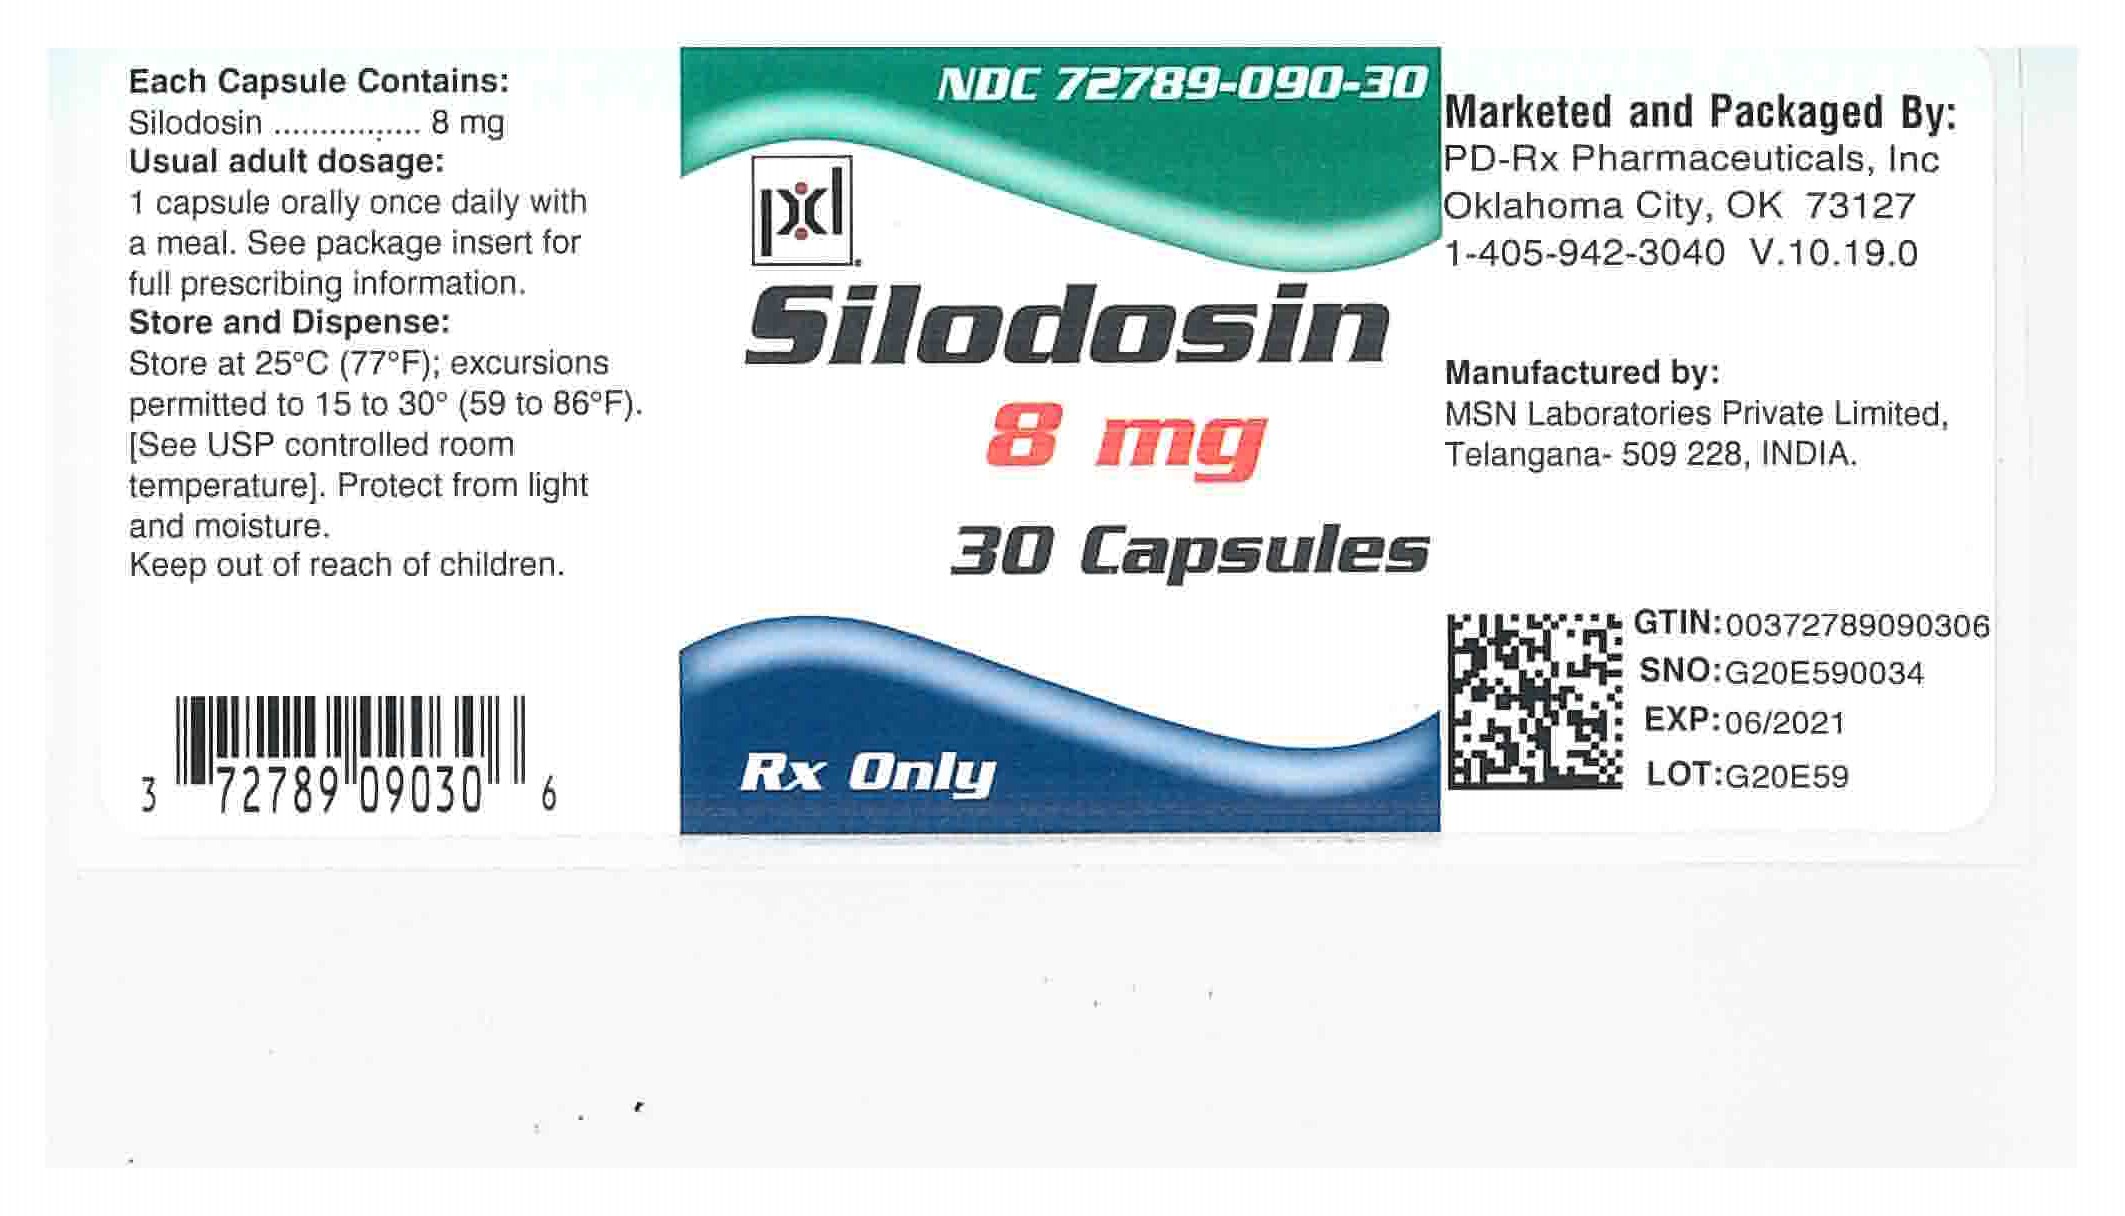
72789090 Label (72789090)
Label for Silodosin 8 mg capsules, containing 30 capsules, marketed and packaged by PD-Rx Pharmaceuticals, Inc., Oklahoma City, OK, and manufactured by MSN Laboratories Private Limited, Telangana, India. The label includes storage instructions, dosage information, barcode, and expiration date of 06/2021.*
FDA Label Image

Figure-01 (Silodosin Figure 01)

Figure-01 (Silodosin Figure 01)
Line graph depicting silodosin concentration (ng/mL) in the blood plasma over time (hours). The plot shows an initial rise reaching peak concentration around 3 to 4 hours, followed by a gradual decline extending to 24 hours. Error bars indicate variability at each time point.*
FDA Label Image

Fig-2 (Silodosin Figure 02)

Fig-2 (Silodosin Figure 02)
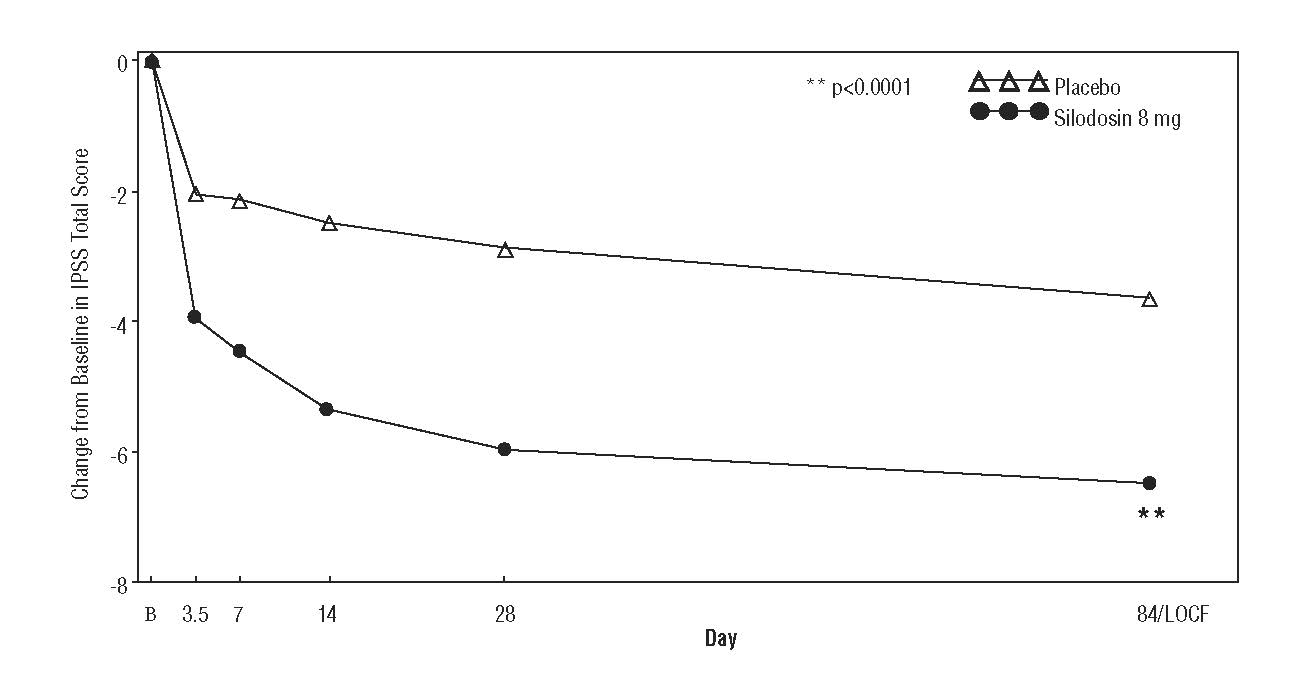
A line graph showing the change from baseline in IPSS Total Score over time (days) comparing placebo and Silodosin 8 mg. The x-axis represents days from baseline up to day 84/LOCF, and the y-axis shows change in score, with Silodosin 8 mg demonstrating a greater reduction than placebo.*
FDA Label Image

Fig-3 (Silodosin Figure 03)

Fig-3 (Silodosin Figure 03)
A line graph depicting change from baseline in IPSS Total Score over time (days) comparing Silodosin 8 mg versus placebo. The x-axis represents days, and the y-axis shows the change from baseline. Silodosin 8 mg shows a greater decrease in IPSS score compared to placebo, with data points at baseline, days 3.5, 7, 14, 28, and 84/LOCF. Statistical significance is noted (p<0.0001).*
FDA Label Image

Fig-4 (Silodosin Figure 04)

Fig-4 (Silodosin Figure 04)
A line graph showing change from baseline in Qmax (mL/sec) over days for Silodosin 8 mg and placebo groups. The x-axis represents days (B, 1, 7, 14, 28, 84/LOCF) and the y-axis shows change in Qmax. Silodosin 8 mg group displays higher Qmax change than placebo, with statistical significance indicated (p < 0.05).*
FDA Label Image

Fig-5 (Silodosin Figure 05)

Fig-5 (Silodosin Figure 05)
A line graph comparing the change from baseline in Qmax (mL/sec) over days for Silodosin 8 mg versus placebo. Data points are shown at baseline and Days 1, 7, 14, 28, and 84/LOCF. Silodosin 8 mg is represented by filled circles, showing a higher increase in Qmax compared to placebo, which is represented by open triangles. Statistical significance is indicated at Day 84/LOCF with p<0.05.*
FDA Label Image

Structure (Silodosin Structure)

Structure (Silodosin Structure)
Chemical structure of silodosin, showing its molecular composition with aromatic rings, amide group, trifluoromethyl group, and hydroxyl group in a detailed 2D line representation.*

* About these descriptions: Image descriptions on this page are generated by automated AI analysis of the product label images from the manufacturer's FDA label submission (SPL). They are provided for reference only and may contain errors or omissions. Always rely on the printed label itself and the official FDA labeling, and consult a pharmacist or healthcare professional with any questions about this product.