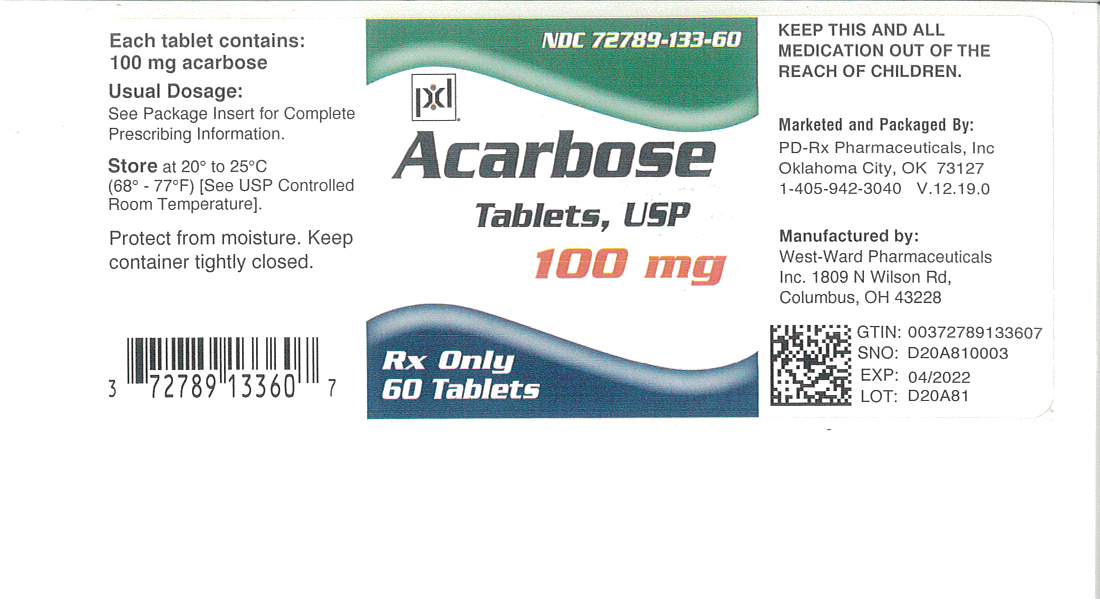
Acarbose Tablet
Product Images NDC 72789-133

6 FDA label images from Pd-rx Pharmaceuticals, Inc. · Packaging, Regulatory Labels, and Product Appearance

Product Visual Gallery

This gallery contains 6 technical images submitted to the FDA as part of the official labeling for Acarbose (NDC 72789-133). Unlike standard consumer photos, these assets often include clinical data figures, molecular chemical structures, and official manufacturer packaging layouts.

As provided by Pd-rx Pharmaceuticals, Inc., these visuals offer a comprehensive scientific overview of the product's physical and chemical identity, aiding pharmacists and researchers in product verification and study.

FDA Label Image

Image (72789131)

Image (72789131)
Label for Acarbose Tablets, USP 25 mg oral tablets by PD-Rx Pharmaceuticals, Inc. This prescription drug package contains 60 tablets. The label includes storage instructions, bar code, and manufacturer information as well as the NDC 72789-131-60.*
FDA Label Image

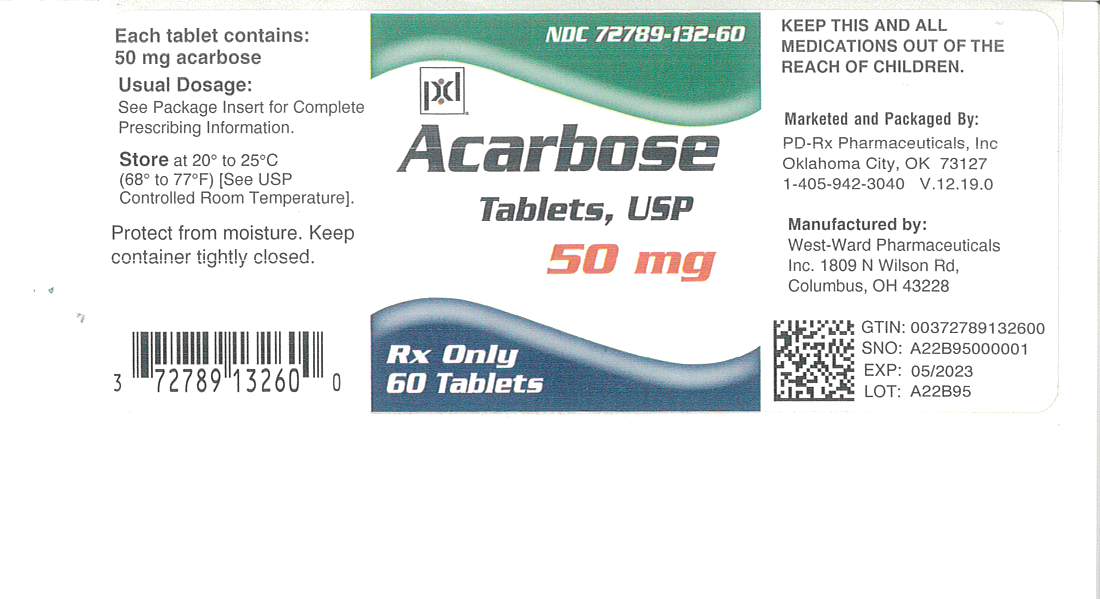
Image (72789132)

Image (72789132)
Acarbose 50 mg tablets label from PD-Rx Pharmaceuticals, Inc. The label states each tablet contains 50 mg acarbose and provides storage instructions at 20° to 25°C. It is marked Rx Only with a count of 60 tablets. Manufactured by West-Ward Pharmaceuticals, Columbus, OH. Includes barcode, NDC 72789-132-60, and expiration date 05/2023.*
FDA Label Image

Image (72789133)

Image (72789133)
Acarbose Tablets USP 100 mg oral tablets packaging label. Contains 60 tablets, marketed and packaged by PD-Rx Pharmaceuticals, Inc., Oklahoma City, OK, and manufactured by West-Ward Pharmaceuticals Inc., Columbus, OH. The label includes storage instructions, dosage reference, barcode, and NDC 72789-133-60.*
FDA Label Image

Acarbosechemstructure.jpg (Image 01)

Acarbosechemstructure.jpg (Image 01)
Chemical structure of Acarbose, the active ingredient in Acarbose tablets by PD-Rx Pharmaceuticals, Inc. The diagram shows a complex polysaccharide structure with multiple hydroxyl groups and glycosidic linkages.*
FDA Label Image

Dose Of Acarbose (Image 02)

Dose Of Acarbose (Image 02)
A bar chart depicting the mean change in plasma glucose (mg/dL) for different doses of Acarbose (25 mg, 50 mg, 100 mg, 200 mg, and 300 mg) administered three times daily (t.i.d.). The number of subjects (N) per dose group is shown inside each bar. The y-axis represents the mean change in plasma glucose, ranging from 0 to -100 mg/dL.*
FDA Label Image

Figure 2 (Image 03)

Figure 2 (Image 03)
Figure 2 presents four line graphs labeled A to D, illustrating changes over 12 months in different treatment groups: A. Diet, B. Sulfonylurea, C. Metformin, and D. Insulin. Each graph plots two data series with values ranging from -1.5 to 1.5 on the vertical axis and time in months (0, 3, 6, 9, 12) on the horizontal axis.*

* About these descriptions: Image descriptions on this page are generated by automated AI analysis of the product label images from the manufacturer's FDA label submission (SPL). They are provided for reference only and may contain errors or omissions. Always rely on the printed label itself and the official FDA labeling, and consult a pharmacist or healthcare professional with any questions about this product.