Atorvastatin Calcium Tablet, Film Coated
Product Images NDC 72789-153

5 FDA label images from Pd-rx Pharmaceuticals, Inc. · Packaging, Regulatory Labels, and Product Appearance

Product Visual Gallery

This gallery contains 5 technical images submitted to the FDA as part of the official labeling for Atorvastatin Calcium (NDC 72789-153). Unlike standard consumer photos, these assets often include clinical data figures, molecular chemical structures, and official manufacturer packaging layouts.

As provided by Pd-rx Pharmaceuticals, Inc., these visuals offer a comprehensive scientific overview of the product's physical and chemical identity, aiding pharmacists and researchers in product verification and study.

FDA Label Image

72789153 Label (72789153)
72789153 Label (72789153)
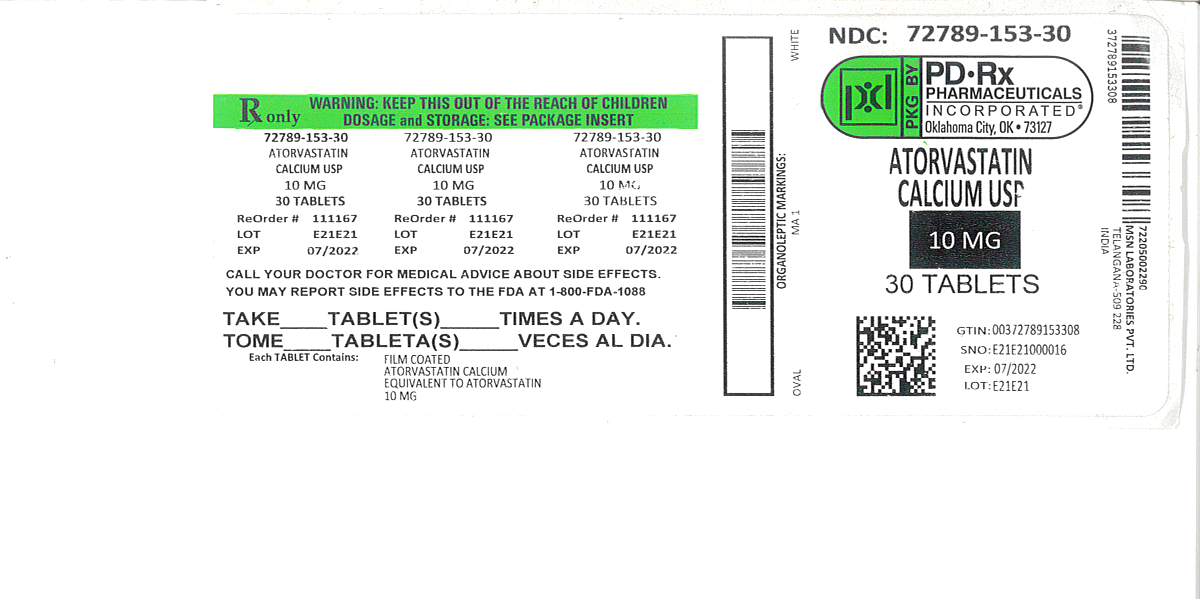
The image shows a white and green label for Atorvastatin calcium USP 10 mg film-coated tablets. It includes the product name, strength, quantity of 30 tablets, and the labeler PD-Rx Pharmaceuticals, Inc. The label features usage instructions, a QR code, barcode, lot number E21E21, and expiration date 07/2022. The packaging emphasizes that the product is prescription-only and advises keeping it out of reach of children.*
FDA Label Image

Figure-01 (Atorvastatin Figure 01)

Figure-01 (Atorvastatin Figure 01)
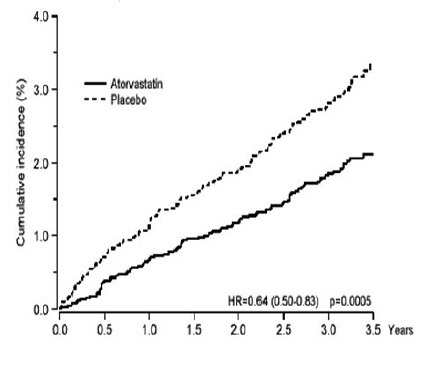
A Kaplan-Meier cumulative incidence curve comparing Atorvastatin and placebo over 3.5 years. The graph plots cumulative incidence percentage on the vertical axis against time in years on the horizontal axis, showing lower cumulative incidence for Atorvastatin compared to placebo, with a hazard ratio of 0.64 and a p-value of 0.0005.*
FDA Label Image

Figure-02 (Atorvastatin Figure 02)

Figure-02 (Atorvastatin Figure 02)
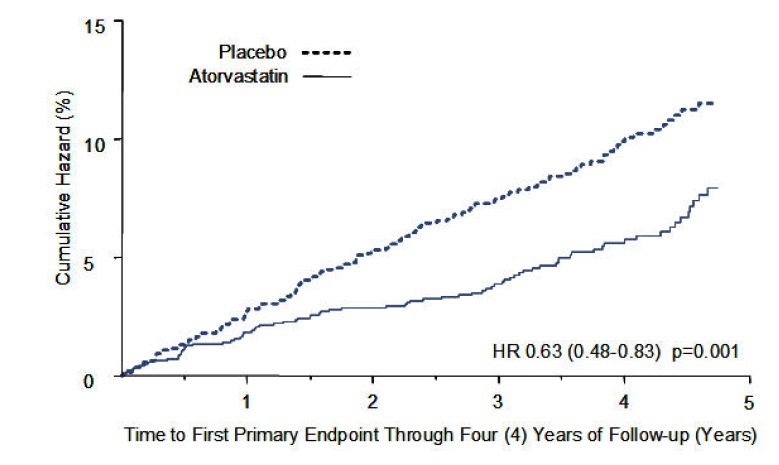
A cumulative hazard line graph comparing Atorvastatin and placebo over time to first primary endpoint through four years of follow-up. The x-axis represents years, and the y-axis shows cumulative hazard percentage. Atorvastatin is represented by a solid line, placebo by a dashed line, with Atorvastatin showing lower cumulative hazard across the period.*
FDA Label Image

Figure-03 (Atorvastatin Figure 03)

Figure-03 (Atorvastatin Figure 03)
A line graph comparing the percentage of subjects experiencing a cardiovascular event over time (up to 5 years) for Atorvastatin 10 mg and 80 mg doses. The x-axis represents time to first major cardiovascular endpoint in years, and the y-axis shows the percentage of subjects experiencing the event. Two lines depict event rates for 10 mg (dashed) and 80 mg (solid) doses.*
FDA Label Image

Structure (Atorvastatin Structure)

Structure (Atorvastatin Structure)
Chemical structure of atorvastatin calcium showing its complex molecular arrangement with associated calcium ions and water molecules as indicated in the diagram.*

* About these descriptions: Image descriptions on this page are generated by automated AI analysis of the product label images from the manufacturer's FDA label submission (SPL). They are provided for reference only and may contain errors or omissions. Always rely on the printed label itself and the official FDA labeling, and consult a pharmacist or healthcare professional with any questions about this product.