Abiraterone Tablet
Product Images NDC 72789-213

6 FDA label images from Pd-rx Pharmaceuticals, Inc. · Packaging, Regulatory Labels, and Product Appearance

Product Visual Gallery

This gallery contains 6 technical images submitted to the FDA as part of the official labeling for Abiraterone (NDC 72789-213). Unlike standard consumer photos, these assets often include clinical data figures, molecular chemical structures, and official manufacturer packaging layouts.

As provided by Pd-rx Pharmaceuticals, Inc., these visuals offer a comprehensive scientific overview of the product's physical and chemical identity, aiding pharmacists and researchers in product verification and study.

FDA Label Image

72789213 Label (72789213)
72789213 Label (72789213)
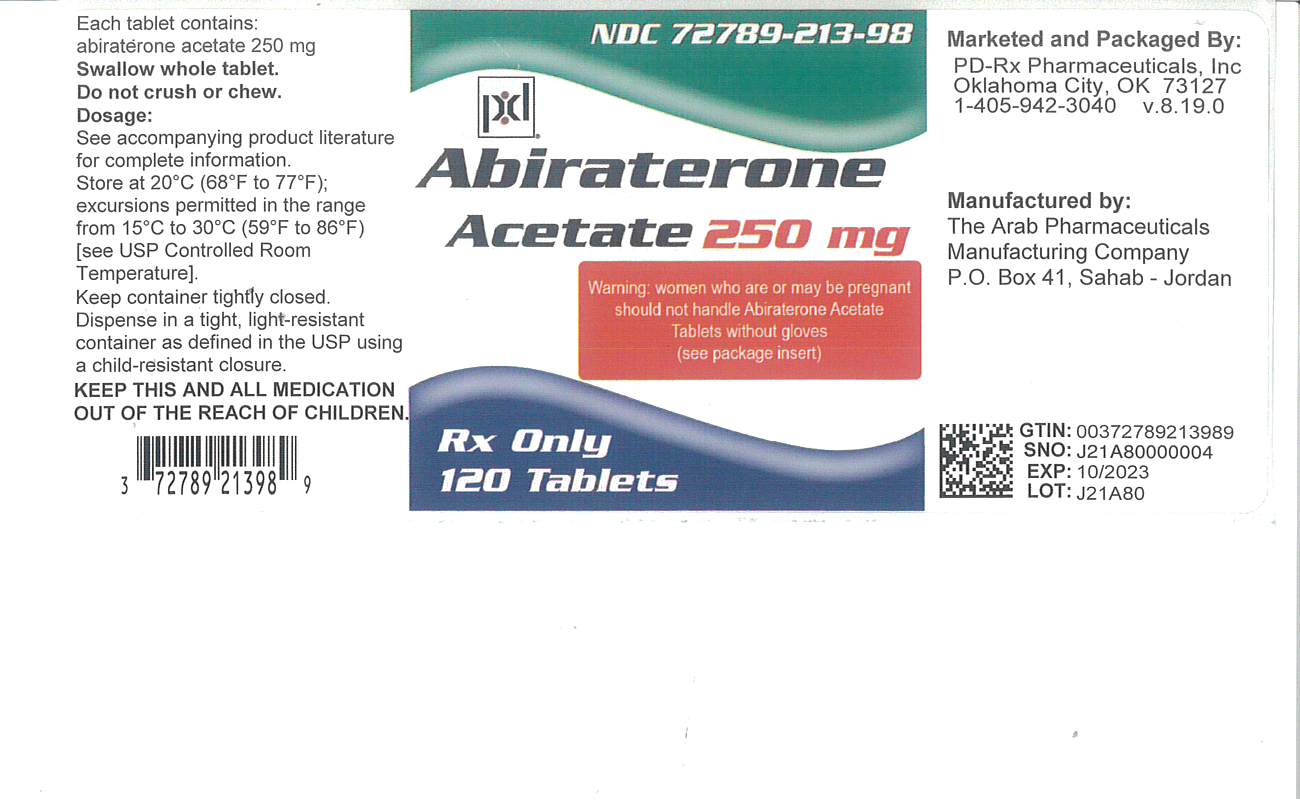
Abiraterone Acetate 250 mg oral tablet label showing the product name, strength, and dosage form. The label includes a warning about handling by women who are or may be pregnant, an instruction to swallow the tablet whole, and storage guidelines. It states the package contains 120 tablets and is marketed by PD-Rx Pharmaceuticals, Inc., and manufactured by The Arab Pharmaceuticals Manufacturing Company in Jordan.*
FDA Label Image

Chemical Structure (Abiraterone Acetate Tablets 1)

Chemical Structure (Abiraterone Acetate Tablets 1)
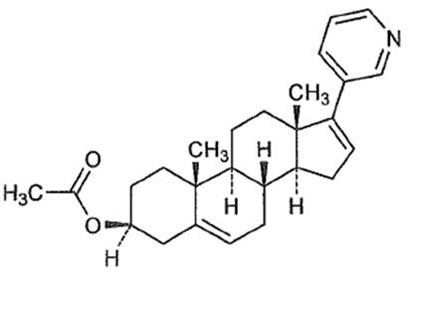
Chemical structure of Abiraterone acetate, showing its steroid-like core with attached acetate group and a pyridine ring, corresponding to the active ingredient in Abiraterone 250 mg oral tablets by PD-Rx Pharmaceuticals, Inc.*
FDA Label Image

Figure 1 (Abiraterone Acetate Tablets 2)

Figure 1 (Abiraterone Acetate Tablets 2)
A survival curve chart comparing percent survival over time in months between patients taking Abiraterone Acetate Tablets and those taking a placebo. The x-axis shows time to death in months, and the y-axis shows percent survival. The chart includes labels for patient numbers at risk at different time points for both groups.*
FDA Label Image

Figure 2 (Abiraterone Acetate Tablets 3)

Figure 2 (Abiraterone Acetate Tablets 3)
A survival curve chart comparing the percentage of subjects without death over months from randomization between Abiraterone Acetate Tablets and placebo. The x-axis represents months from randomization (0 to 60) and the y-axis shows the percentage of subjects without death (0% to 100%). The graph includes two lines, one for placebo and one for Abiraterone Acetate Tablets, with the number of subjects at risk listed below the x-axis.*
FDA Label Image

Figure 3 (Abiraterone Acetate Tablets 4)

Figure 3 (Abiraterone Acetate Tablets 4)
A survival curve chart comparing Abiraterone Acetate Tablets and placebo over 18 months from randomization, showing the percentage of subjects without radiographic progression or death. The x-axis represents months from randomization, and the y-axis shows the percentage of subjects without progression. Sample sizes for each group at various time points are displayed below the x-axis.*
FDA Label Image

Overall Survival, Intent-to-treat Population In Latitude (Abiraterone Acetate Tablets 5)

Overall Survival, Intent-to-treat Population In Latitude (Abiraterone Acetate Tablets 5)
A survival curve chart plotting the percentage of subjects without death over time in months from randomization, comparing Abiraterone acetate versus placebo. The graph includes survival percentages on the y-axis and months on the x-axis, with subject risk counts listed below for both groups at various time points up to 72 months.*

* About these descriptions: Image descriptions on this page are generated by automated AI analysis of the product label images from the manufacturer's FDA label submission (SPL). They are provided for reference only and may contain errors or omissions. Always rely on the printed label itself and the official FDA labeling, and consult a pharmacist or healthcare professional with any questions about this product.