Tadalafil Tablet, Film Coated
Product Images NDC 72789-407

View Photos of Packaging, Regulatory Labels, and Product Appearance

Product Visual Gallery

This gallery contains 10 technical images submitted to the FDA as part of the official labeling for Tadalafil (NDC 72789-407). Unlike standard consumer photos, these assets often include clinical data figures, molecular chemical structures, and official manufacturer packaging layouts.

As provided by Pd-rx Pharmaceuticals, Inc., these visuals offer a comprehensive scientific overview of the product's physical and chemical identity, aiding pharmacists and researchers in product verification and study.

FDA Label Image

72789407 Label (72789407)

72789407 Label (72789407)
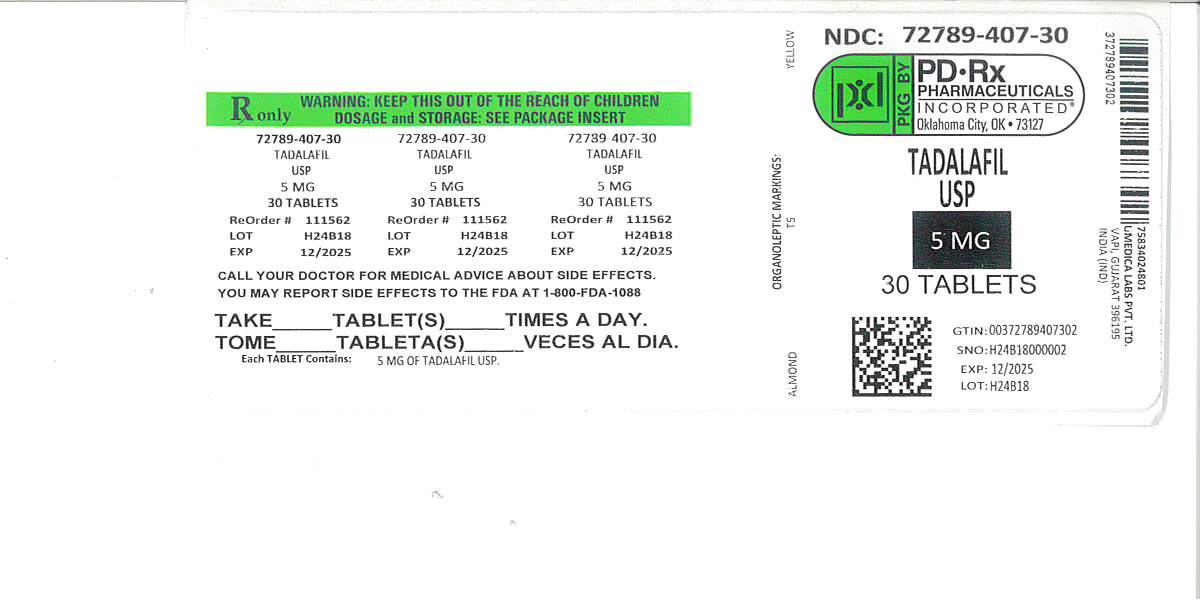
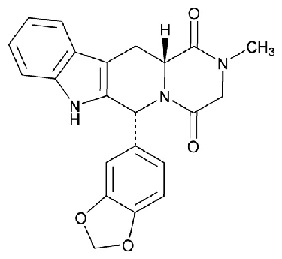
This is a description for Tadalafil tablets in 5 mg strength. Each bottle contains 30 tablets with the expiration date of 12/2025 and lot number H24B18. The tablets are USP approved. The tablets should be taken as directed by your doctor. Additionally, the packaging includes the National Drug Code (NDC) 72789-407-30 for identification.*
FDA Label Image

Tadalafil-figure-1 (Tadalafil Figure 1)

FDA Label Image

Tadalafil-figure-2 (Tadalafil Figure 2)

Tadalafil-figure-2 (Tadalafil Figure 2)
This text provides a comparison of the standing systolic blood pressure (BP) and supine systolic BP readings over time post-dose of Tadalafil 20 mg & doxazosin 8 mg compared to Placebo & doxazosin 8 mg, up to 24 hours after administration.*
FDA Label Image

Tadalafil-figure-3 (Tadalafil Figure 3)

Tadalafil-figure-3 (Tadalafil Figure 3)
This is a document showing the effects of different doses of tadalafil and doxazosin on systolic blood pressure at different times of administration. It compares the systolic blood pressure changes between 20 mg tadalafil with 8 mg doxazosin and a placebo with 8 mg doxazosin at two different time points: 08:00 and 20:00. This information can be useful for understanding the impact of these medications on blood pressure levels over time.*
FDA Label Image

Tadalafil-figure-4 (Tadalafil Figure 4)

Tadalafil-figure-4 (Tadalafil Figure 4)
This is a graph showing the plasma tadalafil concentration (in ug/L) over time (in hours) for different tadalafil dosing regimens. The graph includes data for single 20-mg and 5-mg tadalafil doses, as well as once-daily 5-mg tadalafil following 5 consecutive days of administration.*
FDA Label Image

Tadalafil-figure-5 (Tadalafil Figure 5)

FDA Label Image

Tadalafil-figure-6 (Tadalafil Figure 6)

Tadalafil-figure-6 (Tadalafil Figure 6)
This text describes the change from baseline in IPSS total score over a duration of treatment in weeks, comparing Tadalafil Tablets 5 mg with placebo. The results show a statistically significant difference (*P<0.01) in the total score decrease between the two groups at 24 weeks of treatment.*
FDA Label Image

Tadalafil-figure-7 (Tadalafil Figure 7)

Tadalafil-figure-7 (Tadalafil Figure 7)
This text provides information on the LS Mean Change from Baseline at different weeks of therapy for Tadalafil/Finasteride and Placebo/Finasteride. The Least-Squares Treatment Difference is shown for each week, indicating the change in the treatment groups. The results suggest a significant difference between the two groups in the outcomes, with p-values indicating the level of statistical significance.*
FDA Label Image

Tadalafil-figure-8 (Tadalafil Figure 8)

FDA Label Image

Tadalafil-structure (Tadalafil Structure)

* These product label images have been analyzed using experimental machine learning. Please verify findings with the primary label text.