Imatinib Mesylate Tablet
Product Images NDC 72819-186

View Photos of Packaging, Regulatory Labels, and Product Appearance

Product Visual Gallery

This gallery contains 8 technical images submitted to the FDA as part of the official labeling for Imatinib Mesylate (NDC 72819-186). Unlike standard consumer photos, these assets often include clinical data figures, molecular chemical structures, and official manufacturer packaging layouts.

As provided by Archis Pharma Llc, these visuals offer a comprehensive scientific overview of the product's physical and chemical identity, aiding pharmacists and researchers in product verification and study.

FDA Label Image

Imatinib Mesylate Tablets 400 mg Bottle Label (Image 1)
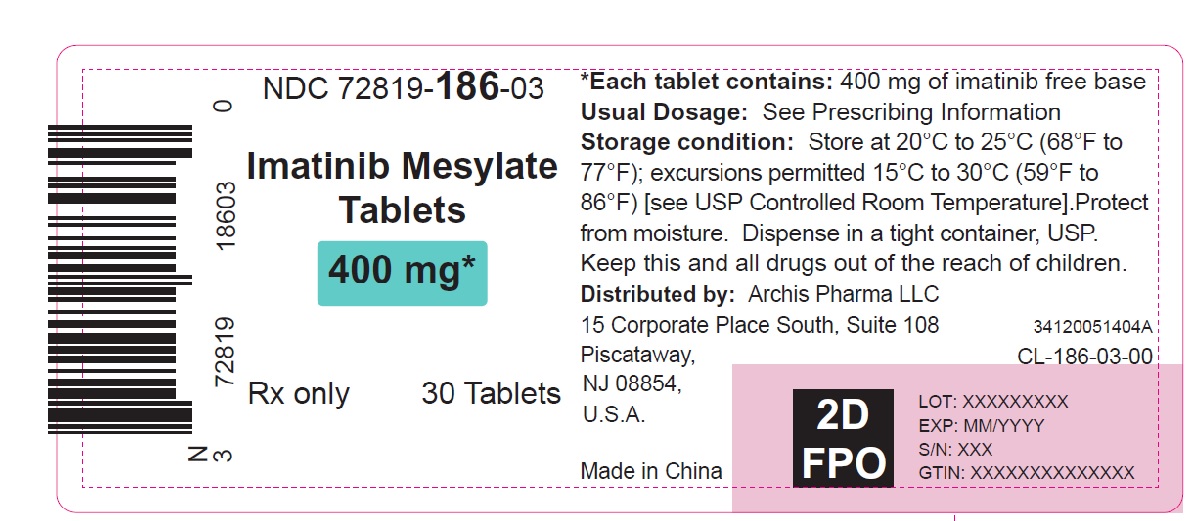
Imatinib Mesylate Tablets 400 mg Bottle Label (Image 1)
Label for Imatinib Mesylate Tablets 400 mg, oral dosage form, containing 30 tablets. The label includes storage instructions and distributor information for Archis Pharma LLC, Piscataway, NJ, USA. The product is marked Rx only and made in China. Barcode and NDC 72819-186-03 are visible.*
FDA Label Image

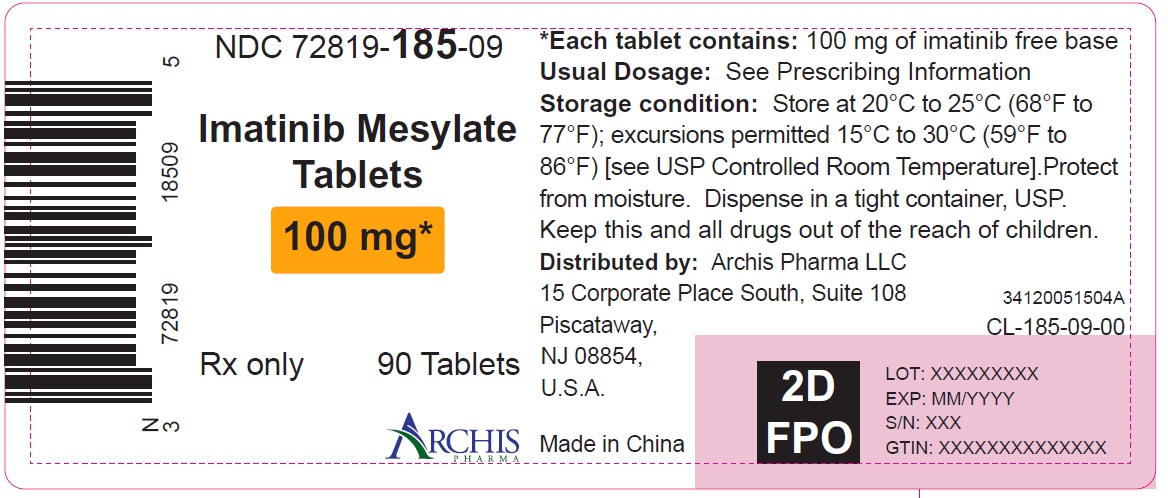
Imatinib Mesylate Tablets 100 mg Bottle Label (Image 2)

Imatinib Mesylate Tablets 100 mg Bottle Label (Image 2)
Label for Imatinib Mesylate Tablets 100 mg, oral dosage form, containing 90 tablets. The label includes storage instructions and distributor information for Archis Pharma LLC, Piscataway, NJ. The label also features barcode, lot, expiration, serial numbers, and GTIN placeholders.*
FDA Label Image

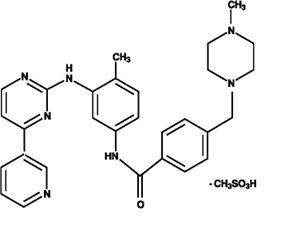
Imatinib Structural Formula (Image 3)

Imatinib Structural Formula (Image 3)
Chemical structure of imatinib mesylate shown as a 2D molecular diagram with labeled functional groups, reflecting its chemical composition including aromatic rings, nitrogen-containing heterocycles, and a mesylate group.*
FDA Label Image

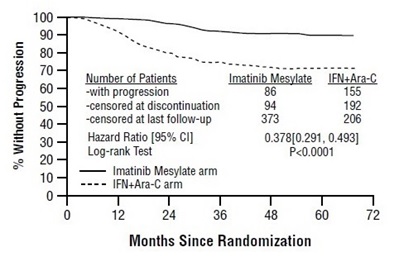
Figure 1 Progression Free Survival (itt Principle) (Image 4)

Figure 1 Progression Free Survival (itt Principle) (Image 4)
A line graph showing the percentage of patients without progression over months since randomization for two treatment arms: Imatinib Mesylate and IFN+Ara-C. The graph includes numerical data for number of patients with progression, censored at discontinuation and last follow-up, hazard ratio with 95% confidence interval, and a log-rank test p-value.*
FDA Label Image

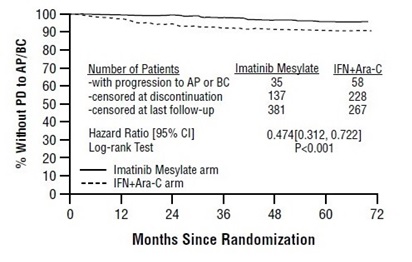
Figure 2 Time To Progression To Ap Or Bc (itt Principle) (Image 5)

Figure 2 Time To Progression To Ap Or Bc (itt Principle) (Image 5)
A line graph comparing the percentage of patients without progression to AP or BC over months since randomization between two arms: Imatinib Mesylate and IFN+Ara-C. The graph includes patient numbers at progression and censoring, hazard ratio with confidence interval, and statistical significance (P<0.001).*
FDA Label Image

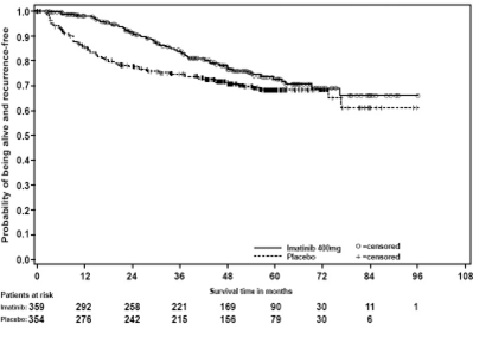
Figure 3: Study 1 Recurrence-free Survival (itt Population) (Image 6)

Figure 3: Study 1 Recurrence-free Survival (itt Population) (Image 6)
A survival curve graph showing the probability of being alive and recurrence-free over time in months for two groups: one treated with 400 mg imatinib and one with placebo. The x-axis represents survival time in months, and the y-axis represents the probability of survival without recurrence. The graph includes censored data points for both groups and a table below indicating the number of patients at risk at various time points.*
FDA Label Image

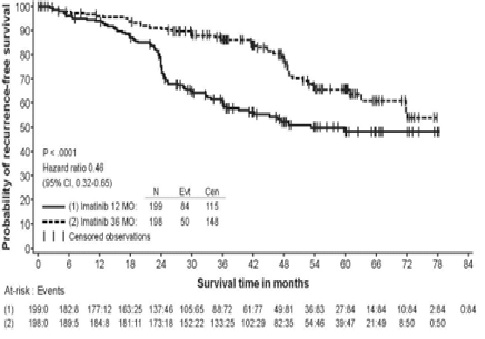
Figure 4: Study 2 Recurrence-free Survival (itt Population) (Image 7)

Figure 4: Study 2 Recurrence-free Survival (itt Population) (Image 7)
A survival curve chart depicting the probability of recurrence-free survival over time in months for patients treated with imatinib mesylate. The graph compares two groups at 12 months and 36 months, indicating different survival probabilities and censored observations, with numerical data for at-risk patients and events below the plot.*
FDA Label Image

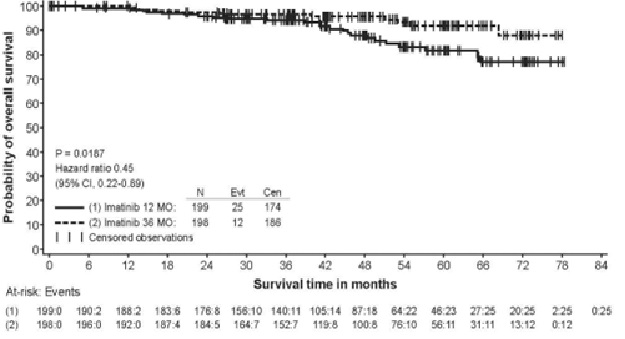
Figure 5: Study 2 Overall Survival (itt Population) (Image 8)

Figure 5: Study 2 Overall Survival (itt Population) (Image 8)
A survival curve chart depicting the probability of overall survival over survival time in months for two groups: Imatinib 12 months (solid line) and Imatinib 36 months (dashed line). The graph includes statistical data such as a p-value, hazard ratio, confidence interval, and the number at risk and events for each group over time.*

* About these descriptions: Image descriptions on this page are generated by automated AI analysis of the product label images from the manufacturer's FDA label submission (SPL). They are provided for reference only and may contain errors or omissions. Always rely on the printed label itself and the official FDA labeling, and consult a pharmacist or healthcare professional with any questions about this product.