Sevelamer Carbonate For Oral Suspension
Product Images NDC 72823-301

View Photos of Packaging, Regulatory Labels, and Product Appearance

Product Visual Gallery

This gallery contains 6 technical images submitted to the FDA as part of the official labeling for Sevelamer Carbonate For Oral Suspension (NDC 72823-301). Unlike standard consumer photos, these assets often include clinical data figures, molecular chemical structures, and official manufacturer packaging layouts.

As provided by Hangzhou Anprime Biopharm Co., Ltd., these visuals offer a comprehensive scientific overview of the product's physical and chemical identity, aiding pharmacists and researchers in product verification and study.

FDA Label Image

Package Label (Principal Display Panel)
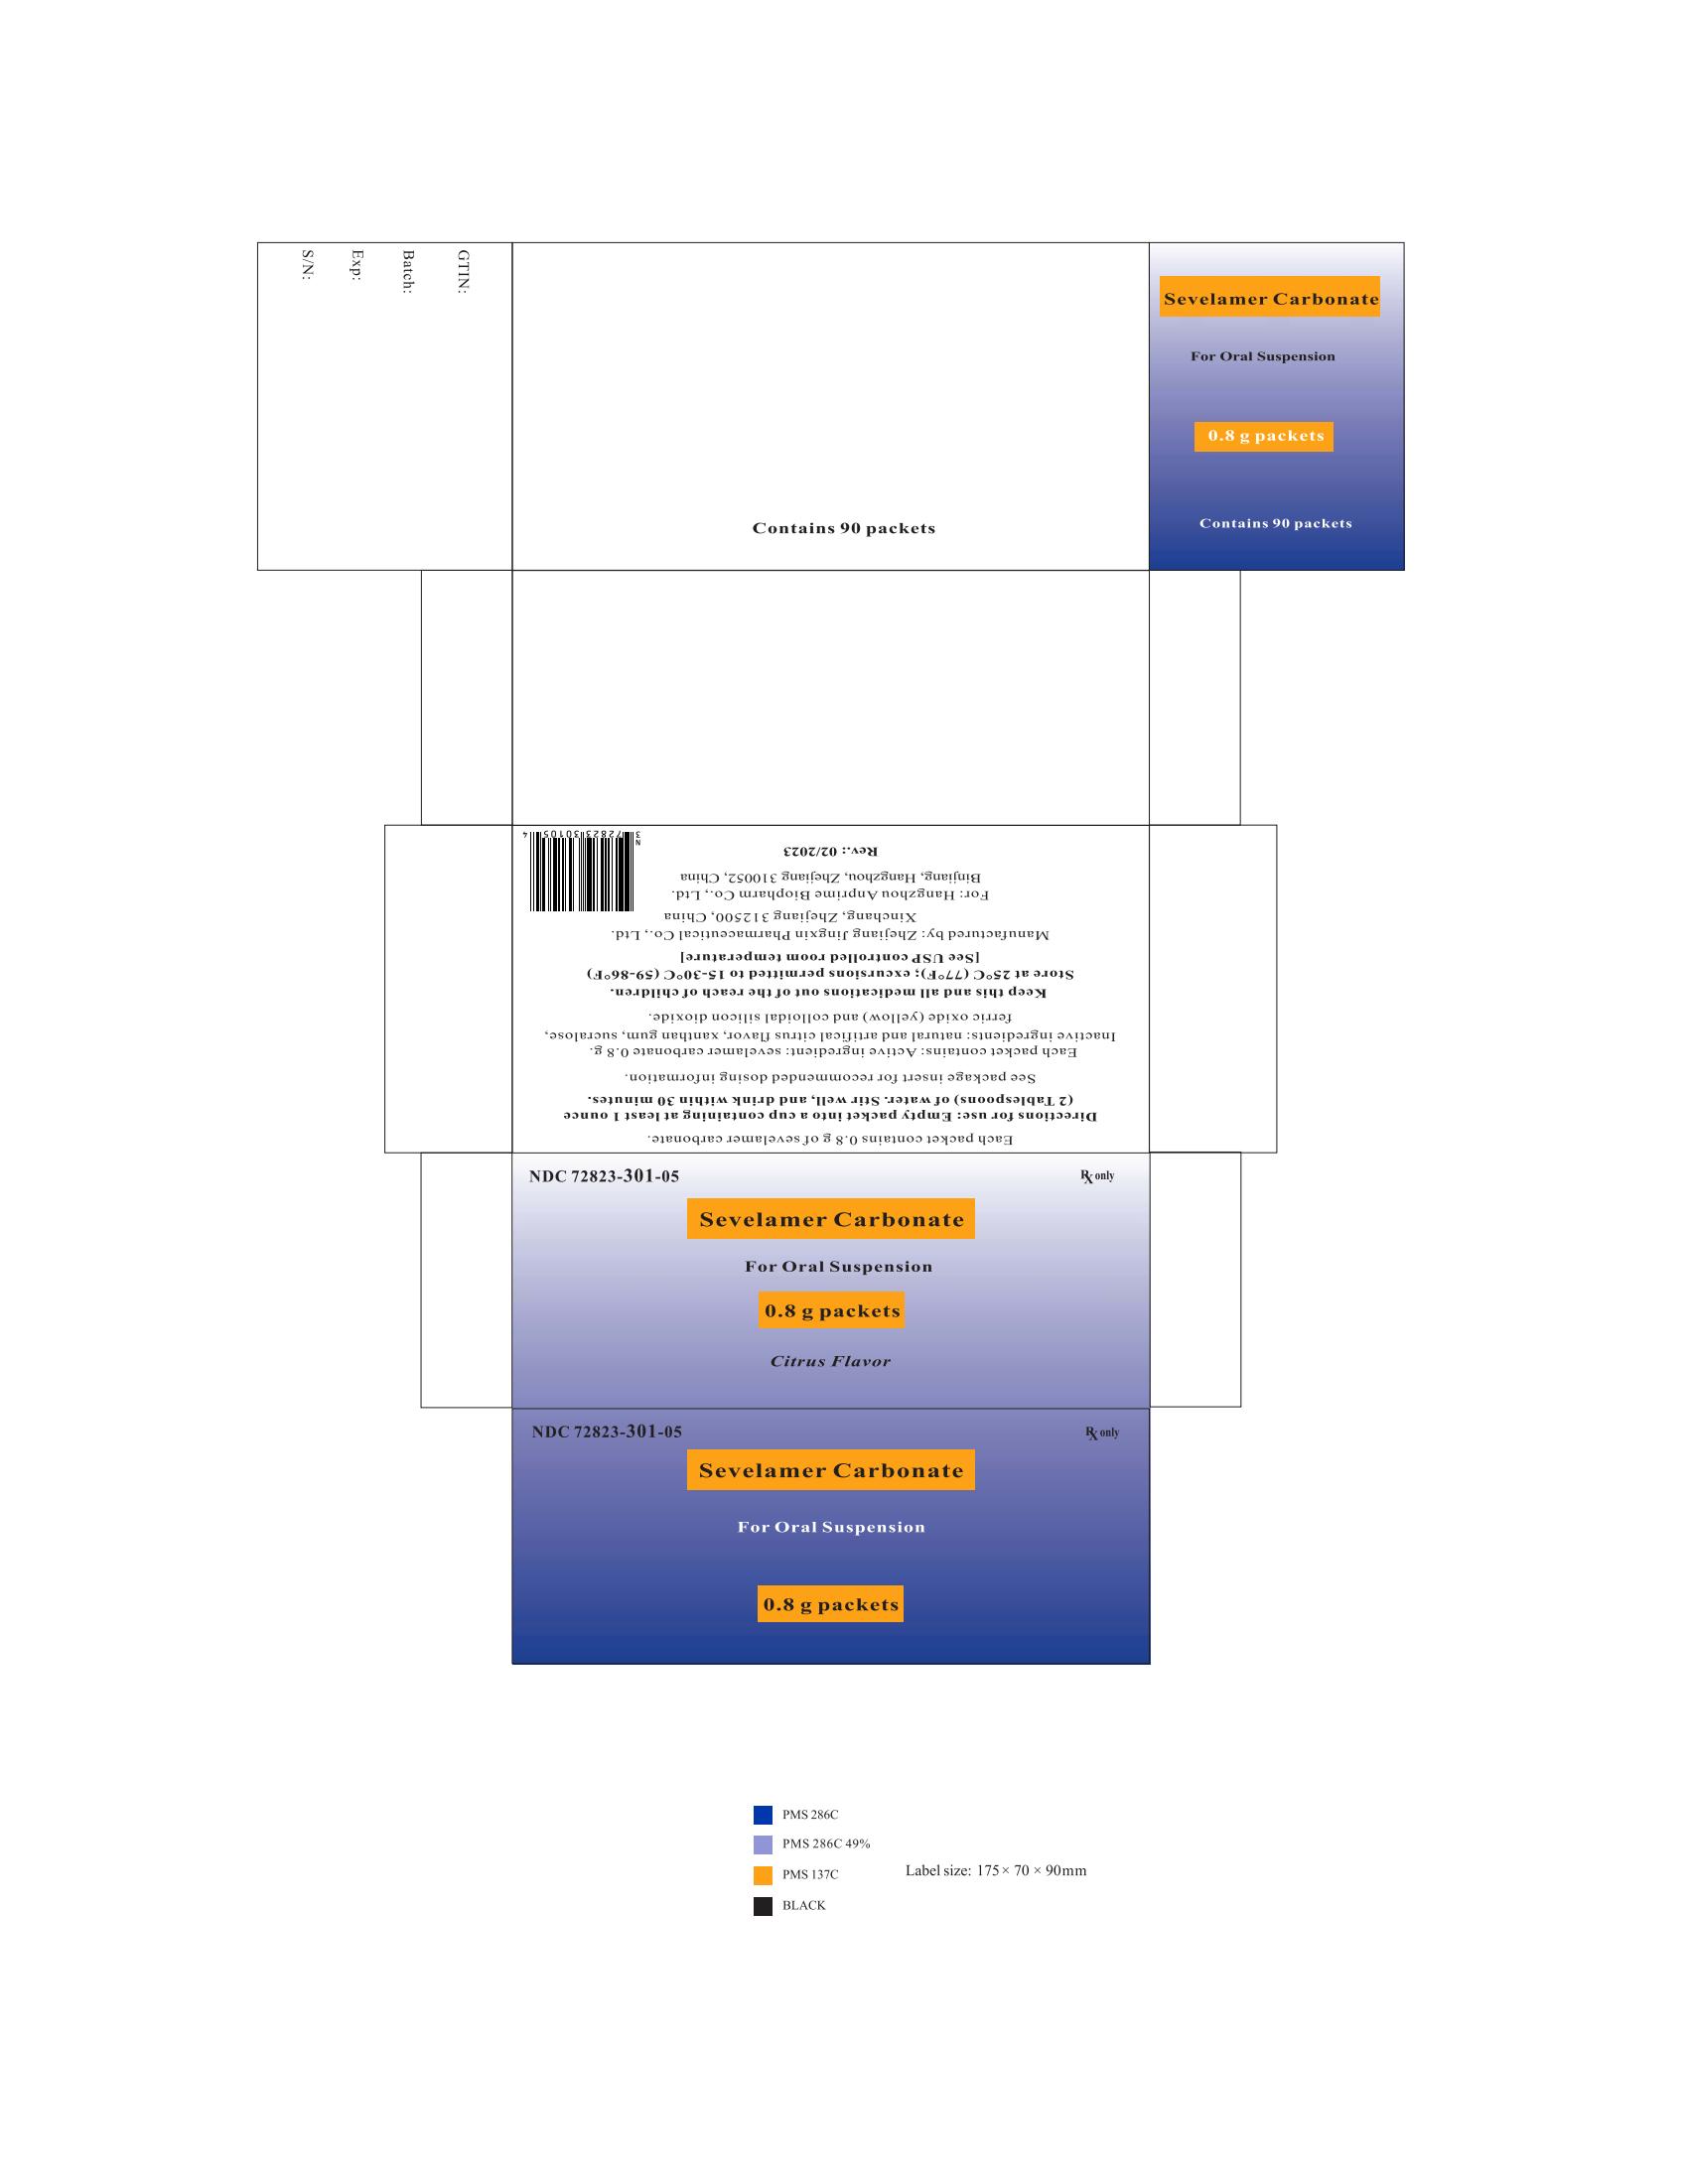
Package Label (Principal Display Panel)
Packaging label for Sevelamer Carbonate For Oral Suspension in 0.8 g packets, containing 90 packets per container. The design features a gradient blue background with orange highlight text boxes displaying the product name and strength. The label includes directions for use and manufacturer information for Hangzhou Anprime Biopharm Co., Ltd.*
FDA Label Image

Package Label (Principal Display Panel)

Package Label (Principal Display Panel)
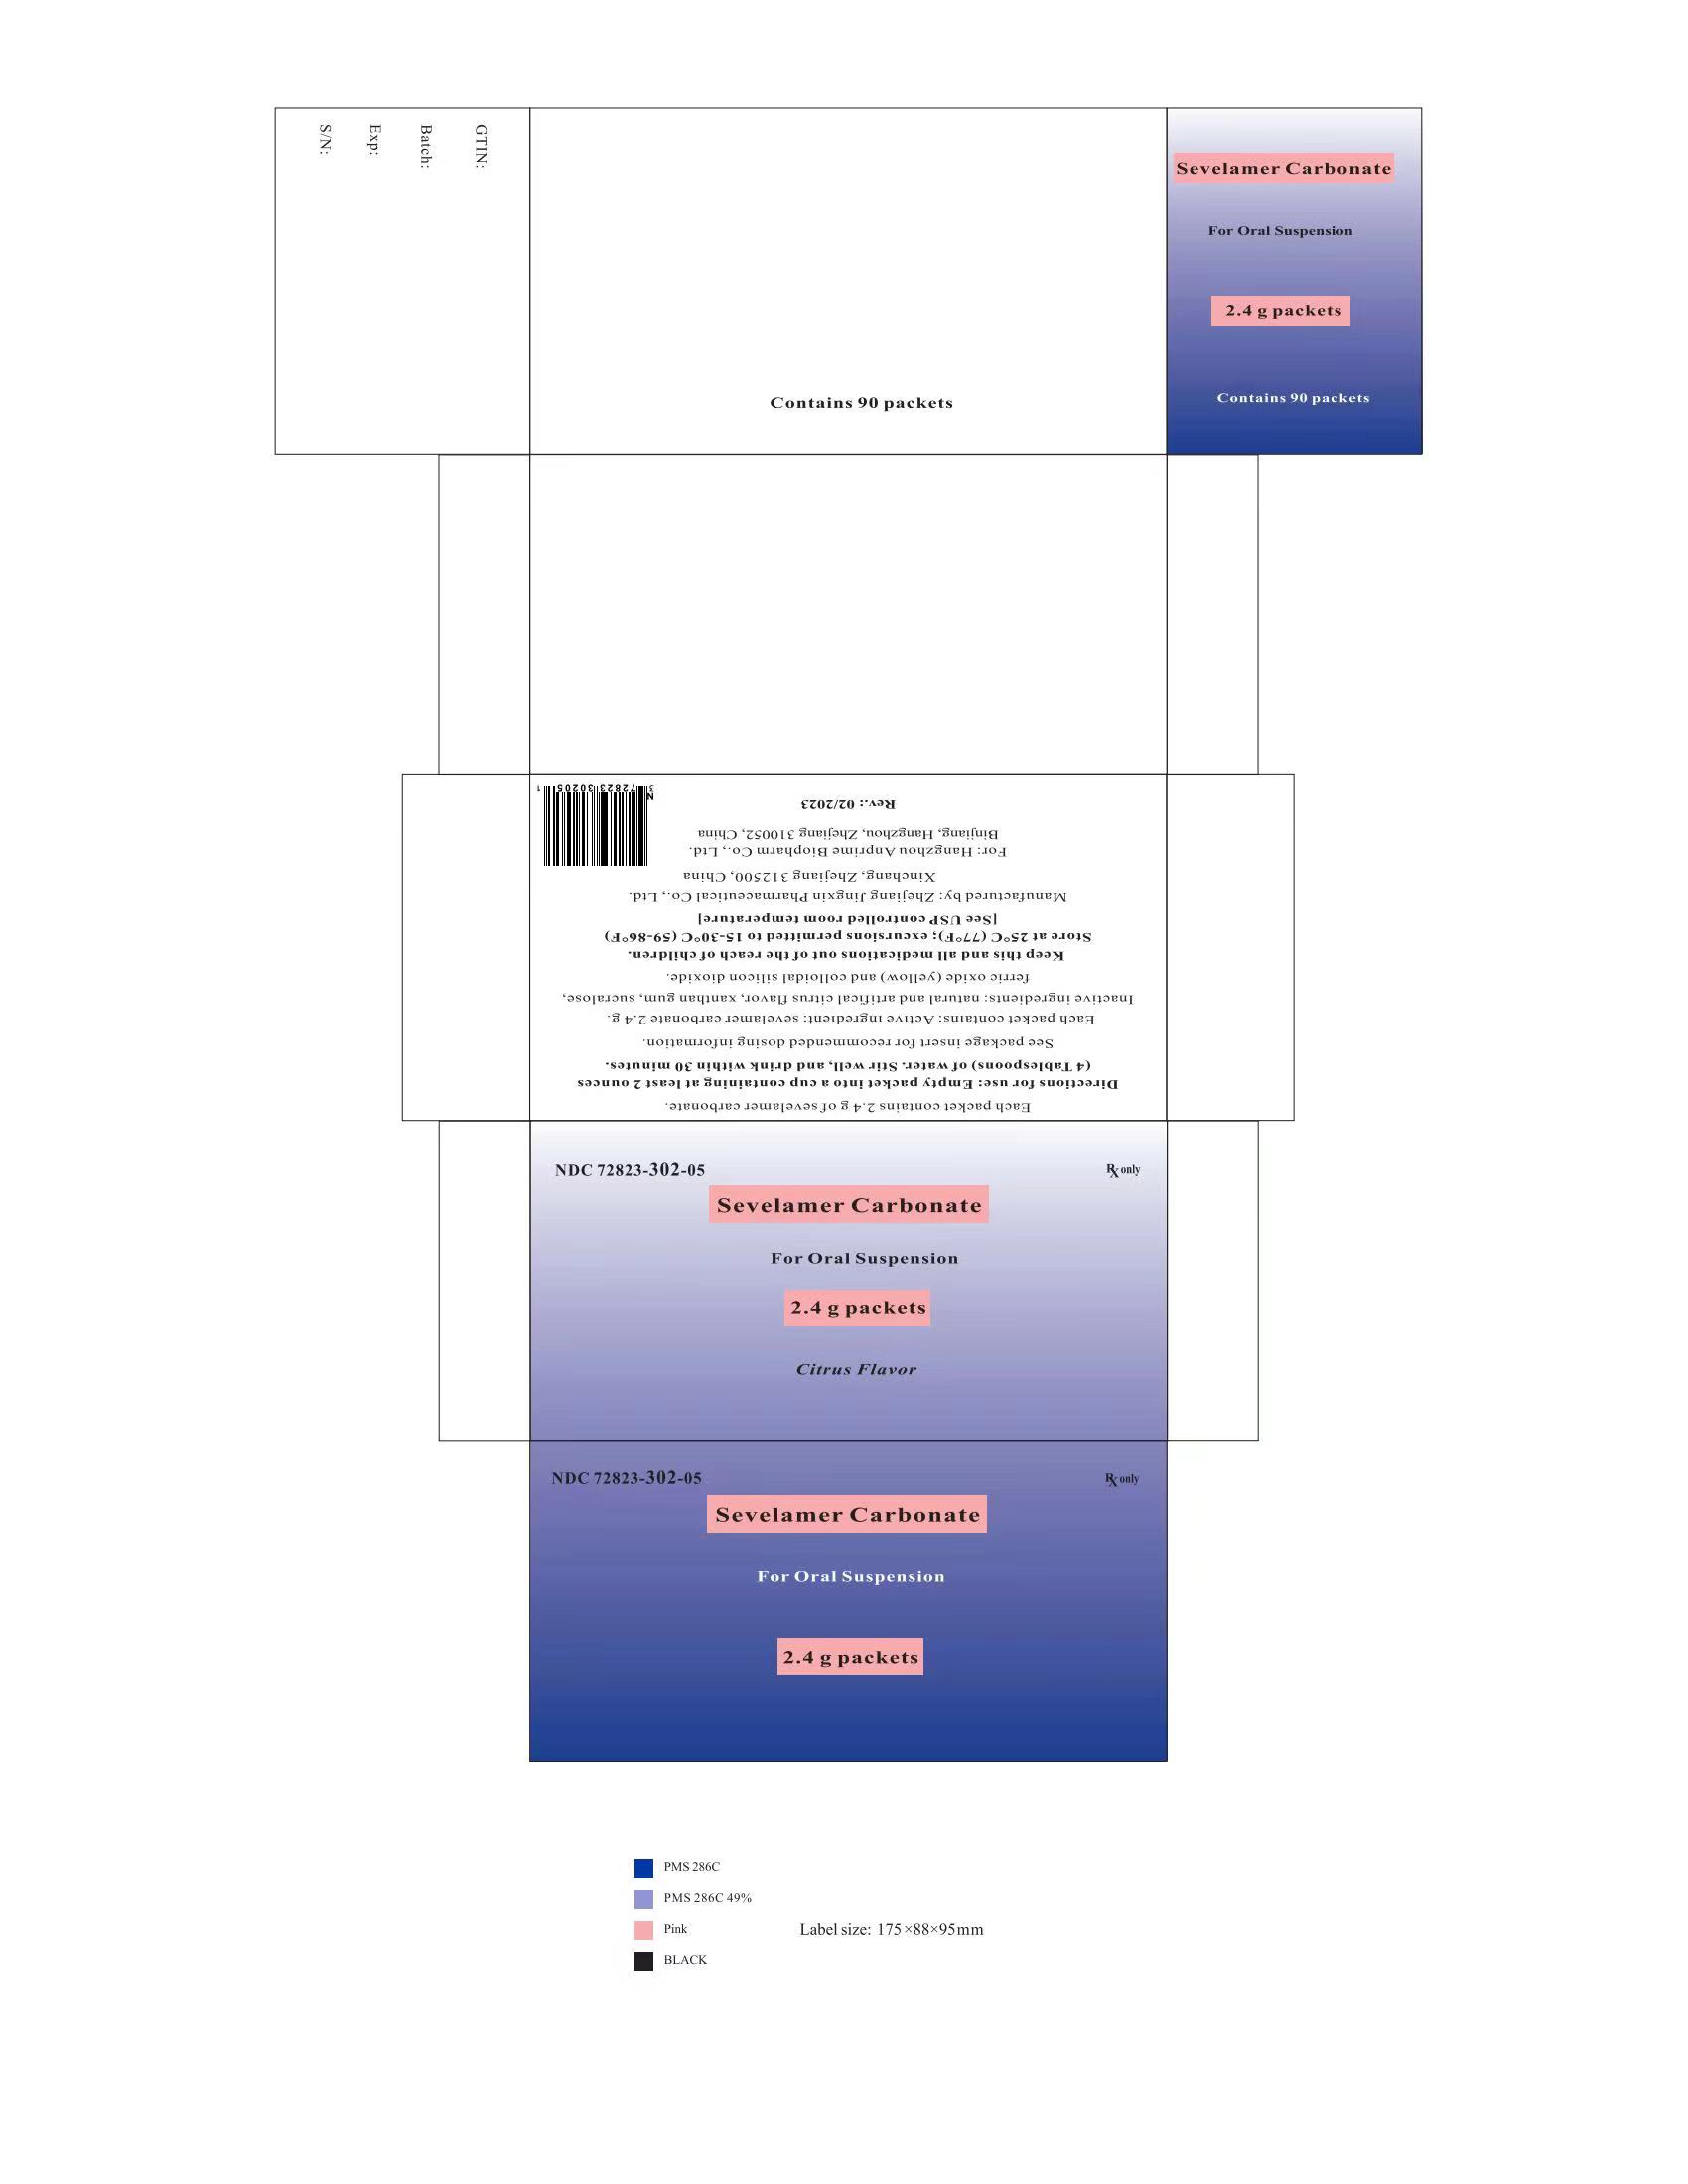
The packaging label for Sevelamer Carbonate For Oral Suspension features a gradient blue background with pink highlights for the product name and packet strength. It states the product is in 2.4 g packets, citrus flavor, and contains 90 packets per container. The label includes the NDC 72823-302-05 and manufacturer information for Hangzhou Anprime Biopharm Co., Ltd., China.*
FDA Label Image

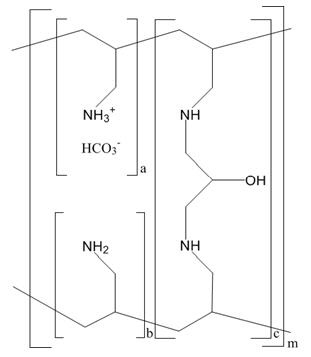
Chemical Structure (Figure 01)

Chemical Structure (Figure 01)
Chemical structure diagram of Sevelamer Carbonate, illustrating its molecular components with labeled functional groups and the polymeric structure indicated by repeating units.*
FDA Label Image

Figure 2 (Figure 02)

Figure 2 (Figure 02)
A forest plot comparing the effects of Sevelamer Carbonate versus placebo across various subgroups including screening BSA, baseline serum phosphorus levels, age, and dialysis status. The plot displays mean differences with 95% confidence intervals, showing data points favoring Sevelamer Carbonate to the left and placebo to the right.*
FDA Label Image

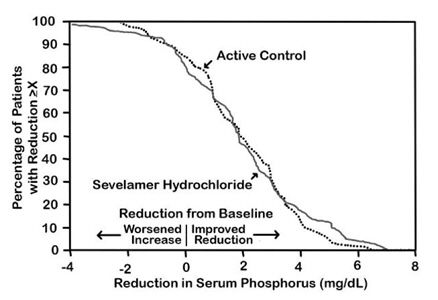
Figure 3 (Figure 03)

Figure 3 (Figure 03)
A line graph comparing the percentage of patients achieving at least 2 times reduction in serum phosphorus levels treated with Sevelamer Hydrochloride versus an active control. The x-axis represents reduction in serum phosphorus (mg/dL) ranging from -4 to 8, while the y-axis shows the percentage of patients from 0 to 100. The chart highlights differences in phosphorus reduction between the two treatments compared to baseline.*
FDA Label Image

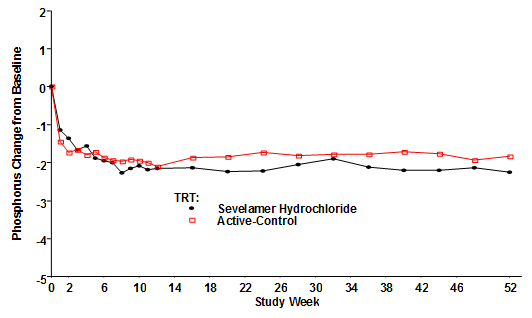
Figure 4 (Figure 04)

Figure 4 (Figure 04)
A line graph showing phosphorus change from baseline over 52 study weeks. Two treatments are compared: Sevelamer Hydrochloride and Active-Control, tracked with different markers. The y-axis measures phosphorus change while the x-axis represents study weeks, illustrating phosphorus level trends for both treatments over time.*

* About these descriptions: Image descriptions on this page are generated by automated AI analysis of the product label images from the manufacturer's FDA label submission (SPL). They are provided for reference only and may contain errors or omissions. Always rely on the printed label itself and the official FDA labeling, and consult a pharmacist or healthcare professional with any questions about this product.