Duloxicaine
Product Images NDC 72835-802

View Photos of Packaging, Regulatory Labels, and Product Appearance

Product Visual Gallery

This gallery contains 11 technical images submitted to the FDA as part of the official labeling for Duloxicaine (NDC 72835-802). Unlike standard consumer photos, these assets often include clinical data figures, molecular chemical structures, and official manufacturer packaging layouts.

As provided by V2 Pharma, Llc, these visuals offer a comprehensive scientific overview of the product's physical and chemical identity, aiding pharmacists and researchers in product verification and study.

FDA Label Image

Duloxicaine Packaging (Duloxicaine Packaging)

Duloxicaine Packaging (Duloxicaine Packaging)
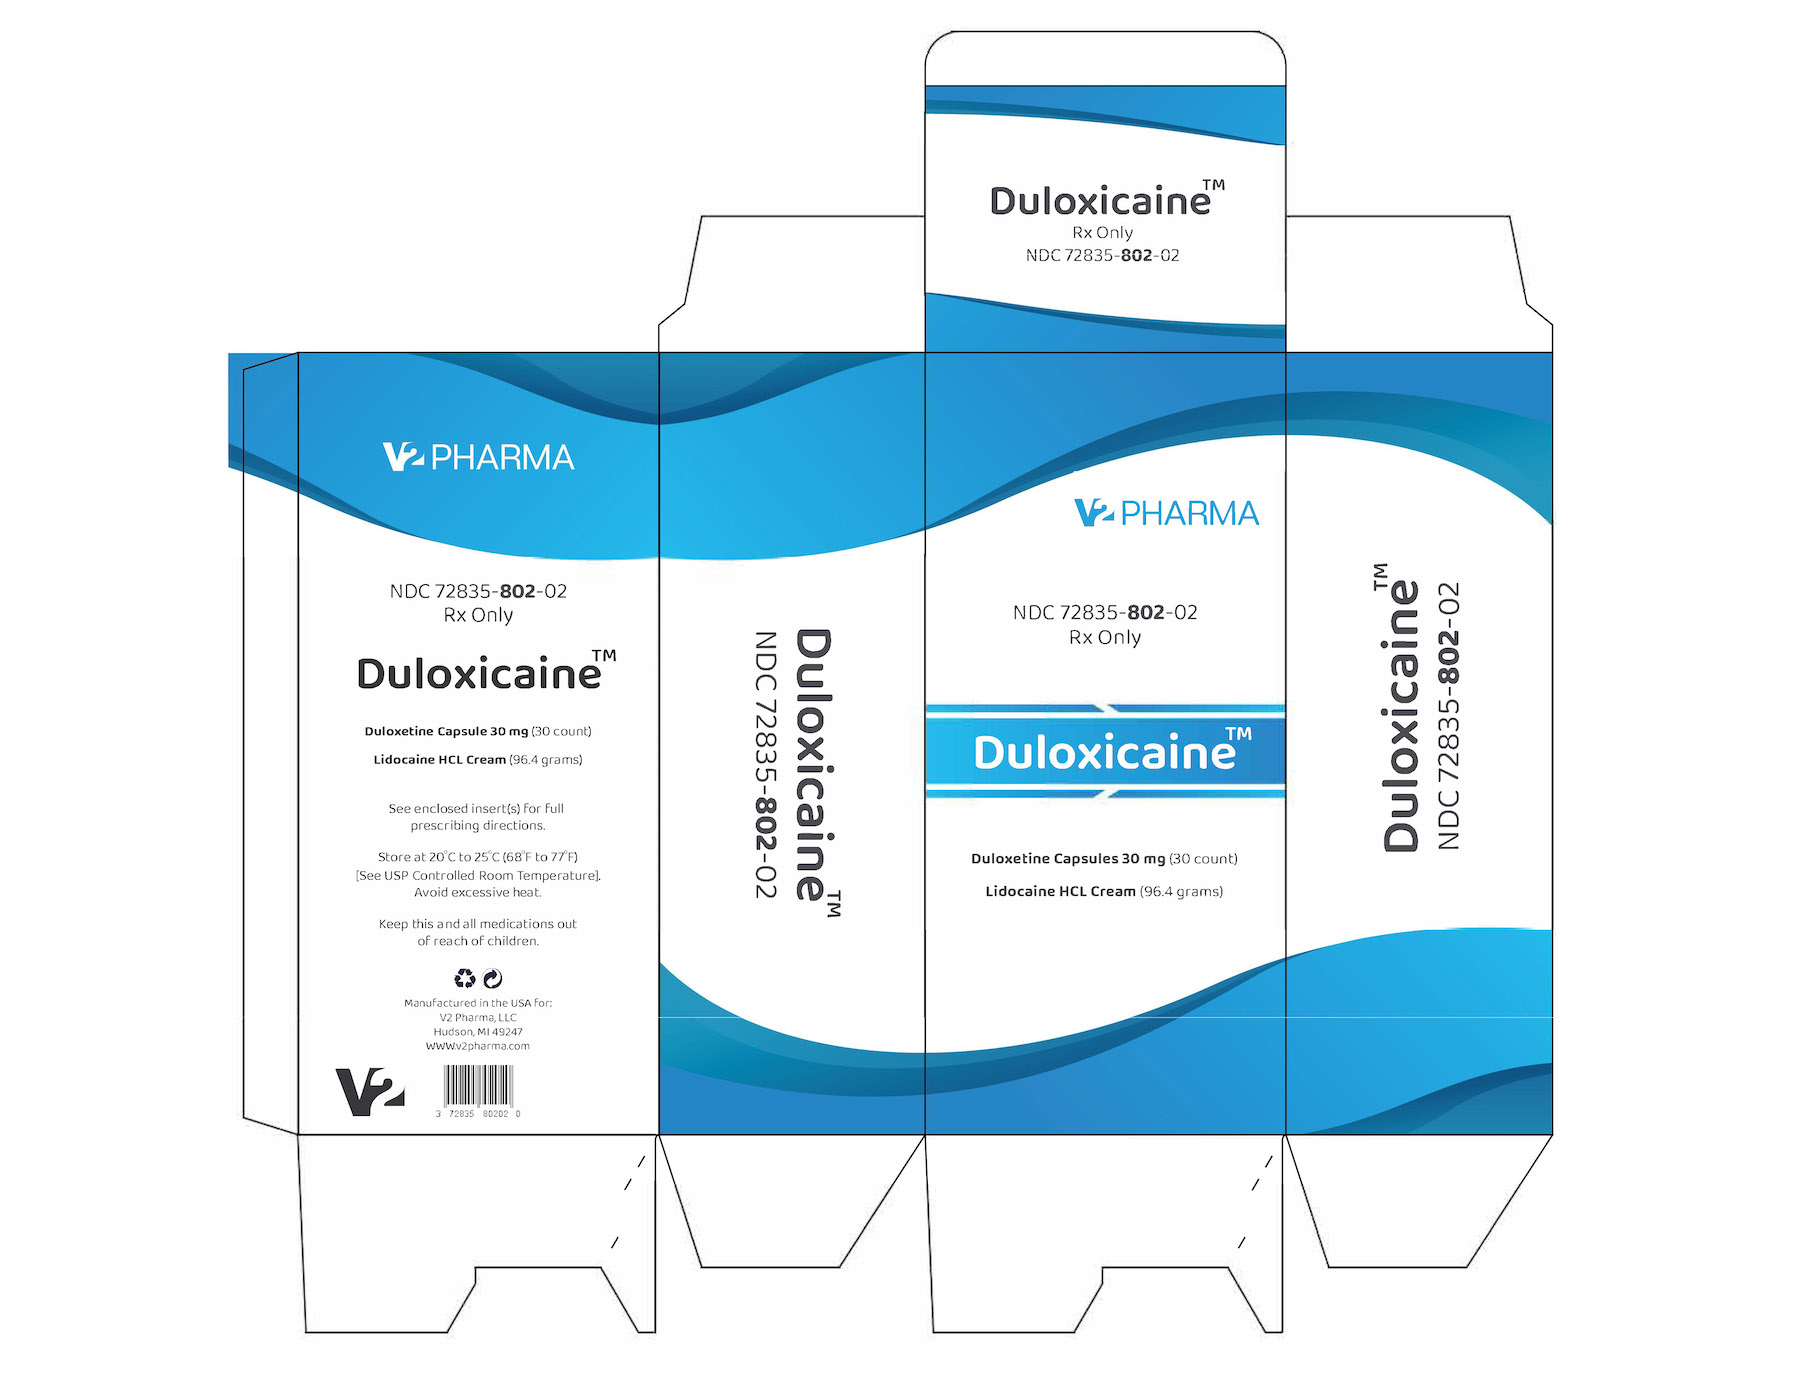
This is a description of a pharmaceutical product manufactured by W Pharma. It includes a Duloxetine Capsule of 30mg (30 count) and Lidocaine HCL Cream (96.4 grams). It also provides the National Drug Code (NDC) 72835-802-02 and mentions that it is RX Only. The enclosed inserts should be referred to for complete prescribing information. It must be stored at a temperature of 20-25°C (68 to 77°F) and USP Controlled Room Temperature should be maintained. It is important to keep this medication away from children.*
FDA Label Image

Structure (C5b0f981 45c3 4e15 B712 984b4a4f6a57 01)

FDA Label Image

Figure 1 (C5b0f981 45c3 4e15 B712 984b4a4f6a57 02)

Figure 1 (C5b0f981 45c3 4e15 B712 984b4a4f6a57 02)
The chart shows the proportion of patients who experienced a relapse over time after being randomized to receive either a placebo or duloxetine for treatment. The x-axis represents the number of days it took for patients to experience a relapse, while the y-axis shows the percentage of patients who relapsed. The higher the curve on the line, the greater the number of relapses. The study used the Kaplan-Meier estimator method to analyze and demonstrate the results.*
FDA Label Image

Figure 2 (C5b0f981 45c3 4e15 B712 984b4a4f6a57 03)

Figure 2 (C5b0f981 45c3 4e15 B712 984b4a4f6a57 03)
This is a graph that shows the proportion of patients with relapse over time from randomization to relapse, comparing the outcomes of a placebo treatment versus Duloxetine. The x-axis represents the time in days, while the y-axis shows the percentage of patients who experienced a relapse. The graph was created using the Kaplan-Meier estimator method.*
FDA Label Image

Figure 1 (C5b0f981 45c3 4e15 B712 984b4a4f6a57 04)

Figure 1 (C5b0f981 45c3 4e15 B712 984b4a4f6a57 04)
This text presents a chart showing the percentage of patients who experienced improvement with different doses of duloxetine and placebo. The effectiveness was measured by the percentage improvement in pain from the baseline. There is not enough information to determine what the acronym "W w m = W [ S R ™" means.*
FDA Label Image

Figure 2 (C5b0f981 45c3 4e15 B712 984b4a4f6a57 05)

Figure 2 (C5b0f981 45c3 4e15 B712 984b4a4f6a57 05)
The text is describing a chart or graph that compares the percentage of patients who have improved in regards to pain levels from a baseline measurement. This comparison is made between three different treatments: Duloxsine 60 mo BID, Duloxetine 60 mg QD, and Placebo. The data is presented using percentages, with the variable "R" being used to represent the percent improvement in pain from baseline for each treatment.*
FDA Label Image

Fig 5 (C5b0f981 45c3 4e15 B712 984b4a4f6a57 06)

Fig 5 (C5b0f981 45c3 4e15 B712 984b4a4f6a57 06)
The text describes a chart that displays the percentage of patients who experienced improvement in pain with the use of Duloxetine (60 mg, twice daily or once daily) compared to a Placebo. The chart shows different levels of improvement (ranging from 0% to 100%) on the horizontal axis and the percentage of patients who experienced that level of improvement on the vertical axis.*
FDA Label Image

Fig 6 (C5b0f981 45c3 4e15 B712 984b4a4f6a57 07)

Fig 6 (C5b0f981 45c3 4e15 B712 984b4a4f6a57 07)
This is a graph showing the percentage of patients who improved while taking Duloxetine at 120mg twice daily, Duloxetine at 60mg once daily, and a placebo. The horizontal axis shows the percentage of improvement in pain from baseline, while the vertical axis shows the number of patients.*
FDA Label Image

Figure 8 (C5b0f981 45c3 4e15 B712 984b4a4f6a57 08)

Figure 8 (C5b0f981 45c3 4e15 B712 984b4a4f6a57 08)
This is a graph that shows the percentage of patients who experienced improvement in pain from baseline after taking Duloxetine 60/120 mg once daily compared to placebo. The graph ranges from 0-100% improvement and shows various percentage points on the y-axis and different levels of percent improvement on pain from the baseline on the x-axis.*
FDA Label Image

Figure 9 (C5b0f981 45c3 4e15 B712 984b4a4f6a57 09)

Figure 9 (C5b0f981 45c3 4e15 B712 984b4a4f6a57 09)
The text provides data regarding the percentage of patients improved by Duloxetine 60mg compared to a placebo. The chart shows that at a once-daily dosage, 100% of patients improved with Duloxetine while the placebo had 0% improvement. Additionally, the text shows a chart displaying percent improvement in pain from baseline, which includes numerical values up to 100%.*
FDA Label Image

Figure 10 (C5b0f981 45c3 4e15 B712 984b4a4f6a57 10)

* These product label images have been analyzed using experimental machine learning. Please verify findings with the primary label text.