Aripiprazole Tablet
Product Images NDC 72865-158

15 FDA label images from Xlcare Pharmaceuticals, Inc. · Packaging, Regulatory Labels, and Product Appearance

Product Visual Gallery

This gallery contains 15 technical images submitted to the FDA as part of the official labeling for Aripiprazole (NDC 72865-158). Unlike standard consumer photos, these assets often include clinical data figures, molecular chemical structures, and official manufacturer packaging layouts.

As provided by Xlcare Pharmaceuticals, Inc., these visuals offer a comprehensive scientific overview of the product's physical and chemical identity, aiding pharmacists and researchers in product verification and study.

FDA Label Image

10 mg (10 mg 500 Ct)

10 mg (10 mg 500 Ct)
Aripiprazole Tablets, USP 10 mg oral tablets label from XLCare Pharmaceuticals, Inc. The label indicates a package size of 500 tablets and states each tablet contains 10 mg of aripiprazole. It includes storage instructions, manufacturing information, Rx only status, and a barcode.*
FDA Label Image

15 mg (15 mg 500 Ct)

15 mg (15 mg 500 Ct)
Label for Aripiprazole Tablets USP 15 mg by XLCare Pharmaceuticals, Inc. The label states NDC 72865-156-05, quantity of 500 tablets, and includes storage instructions and manufacturer information. It highlights that each tablet contains 15 mg of aripiprazole and includes a pharmacist note to dispense a Medication Guide to each patient.*
FDA Label Image

2 mg (2 mg 500 Ct)

2 mg (2 mg 500 Ct)
Label for Aripiprazole Tablets USP 2 mg oral tablets by XLCare Pharmaceuticals, Inc. The label indicates a 500-tablet bottle with instructions to dispense the Medication Guide to each patient. Storage and manufacturing details are included, with dosage references directing to package inserts.*
FDA Label Image

20 mg (20 mg 500 Ct)

20 mg (20 mg 500 Ct)
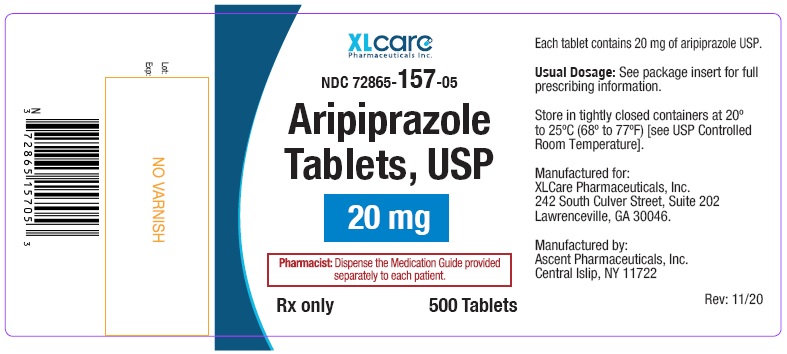
Label for Aripiprazole Tablets, USP 20 mg oral tablets by XLCare Pharmaceuticals, Inc. The label displays the NDC number 72865-157-05 and indicates a package size of 500 tablets. It includes storage instructions, manufacturer details, and a pharmacist notice about dispensing the medication guide.*
FDA Label Image

30 mg (30 mg 500 Ct)

30 mg (30 mg 500 Ct)
Label for Aripiprazole Tablets, USP 30 mg, oral tablets manufactured by XLCare Pharmaceuticals, Inc. The label shows the National Drug Code (NDC) 72865-158-05 and indicates a package containing 500 tablets. It includes storage instructions, dosage guidance reference, and manufacturer details for XLCare Pharmaceuticals, Inc. and Ascent Pharmaceuticals, Inc.*
FDA Label Image

5 mg (5 mg 500 Ct)

5 mg (5 mg 500 Ct)
Label for Aripiprazole Tablets, USP 5 mg by XLCare Pharmaceuticals, Inc. The label includes the NDC 72865-154-05 and indicates a package size of 500 tablets. It features storage instructions, manufacturer details, and a note to pharmacists to dispense a separate Medication Guide.*
FDA Label Image

Fig-1 (Figure 1)

Fig-1 (Figure 1)
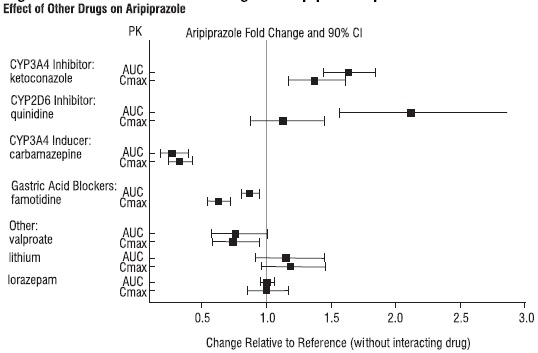
A chart titled 'Effect of Other Drugs on Aripiprazole' showing fold change and 90% confidence intervals for area under the curve (AUC) and maximum concentration (Cmax) of aripiprazole when co-administered with various drugs, including CYP3A4 inhibitors and inducers, CYP2D6 inhibitors, gastric acid blockers, and other drugs like valproate, lithium, and lorazepam. The horizontal axis measures change relative to a reference without interacting drug.*
FDA Label Image

Fig-2 (Figure 2)

Fig-2 (Figure 2)
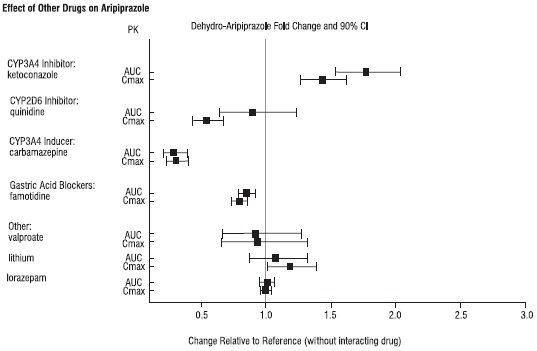
A chart depicting the pharmacokinetic effects of other drugs on Aripiprazole, showing fold change and 90% confidence intervals for AUC and Cmax values. The drugs listed include CYP3A4 inhibitor ketoconazole, CYP2D6 inhibitor quinidine, CYP3A4 inducer carbamazepine, gastric acid blockers famotidine, and others such as valproate, lithium, and lorazepam. The x-axis represents change relative to reference without interacting drug.*
FDA Label Image

Fig-3 (Figure 3)

Fig-3 (Figure 3)
A chart illustrating the effect of Aripiprazole on the pharmacokinetics of various drugs, showing fold change and 90% confidence intervals for parameters such as AUC and Cmax relative to a reference without interacting drug. The x-axis represents change relative to reference, ranging from 0.5 to 3.0, with multiple drugs listed on the y-axis including warfarin, omeprazole, valproate, lithium, and others.*
FDA Label Image

Fig-4 (Figure 4)

Fig-4 (Figure 4)
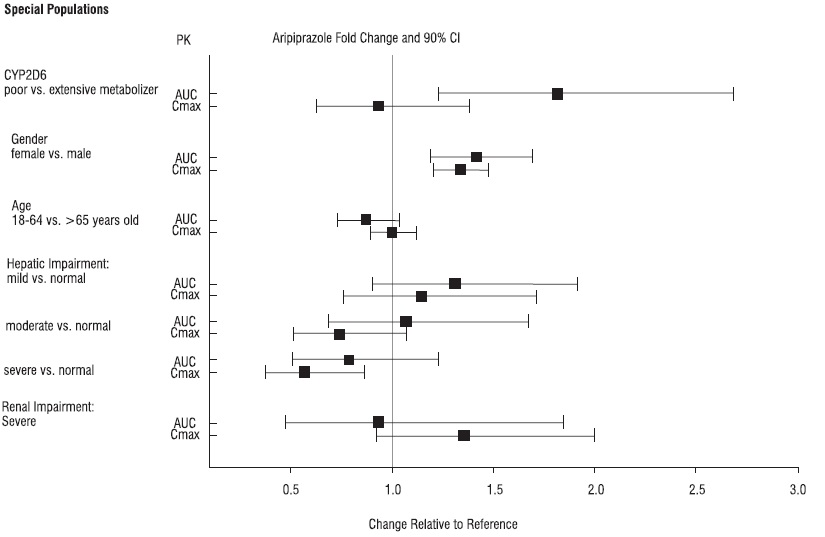
A chart titled 'Aripiprazole Fold Change and 90% CI' illustrating pharmacokinetic (PK) changes in various special populations. It compares AUC and Cmax values for groups defined by CYP2D6 metabolizer status, gender, age, hepatic impairment severity, and severe renal impairment. The x-axis shows change relative to reference from 0.5 to 3.0, with black squares and horizontal error bars indicating fold changes and 90% confidence intervals for each group.*
FDA Label Image

Fig-5 (Figure 5)

Fig-5 (Figure 5)
A pharmacokinetic chart titled 'Dehydro-Aripiprazole Fold Change and 90% CI' showing fold changes in AUC and Cmax relative to reference for different variables including CYP2D6 metabolizer status, gender, age groups, hepatic impairment levels, and severe renal impairment. The x-axis represents change relative to reference, and data points with error bars illustrate the variation for each category.*
FDA Label Image

Fig-6 (Figure 6)

Fig-6 (Figure 6)
Kaplan-Meier plot showing the proportion of subjects with relapse over 182 days from randomization, comparing Aripiprazole and placebo groups. The x-axis represents days from randomization, and the y-axis shows the proportion with relapse. A table below the graph displays the number of subjects at risk for each group at various time points.*
FDA Label Image

Fig-7 (Figure 7)

Fig-7 (Figure 7)
A line graph comparing the proportion of relapse over time in subjects treated with Aripiprazole versus placebo. The x-axis represents days from randomization up to 182 days, and the y-axis shows the proportion with relapse from 0 to 1. The graph includes the number of subjects at risk for each treatment group over time and has a legend differentiating Aripiprazole (solid line) and placebo (dashed line).*
FDA Label Image

Fig-8 (Figure 8)

Fig-8 (Figure 8)
A line graph comparing the proportion of subjects with relapse over 364 days from randomization between Aripiprazole and placebo groups. The x-axis represents days from randomization, and the y-axis shows the proportion with relapse. Aripiprazole shows a lower relapse proportion than placebo throughout the study. The number of subjects at risk is noted below the x-axis for each group at various time points.*
FDA Label Image

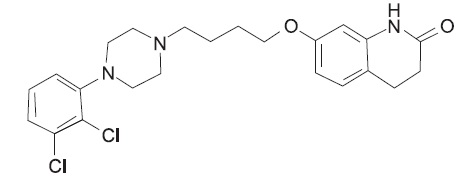
Struct (Structure)

Struct (Structure)
Chemical structure diagram of Aripiprazole, showing the arrangement of its molecular components including chlorine-substituted aromatic rings, piperazine, and quinolinone groups.*

* About these descriptions: Image descriptions on this page are generated by automated AI analysis of the product label images from the manufacturer's FDA label submission (SPL). They are provided for reference only and may contain errors or omissions. Always rely on the printed label itself and the official FDA labeling, and consult a pharmacist or healthcare professional with any questions about this product.