Lenalidomide Capsule
Product Images NDC 73043-043

View Photos of Packaging, Regulatory Labels, and Product Appearance

Product Visual Gallery

This gallery contains 15 technical images submitted to the FDA as part of the official labeling for Lenalidomide (NDC 73043-043). Unlike standard consumer photos, these assets often include clinical data figures, molecular chemical structures, and official manufacturer packaging layouts.

As provided by Devatis Inc., these visuals offer a comprehensive scientific overview of the product's physical and chemical identity, aiding pharmacists and researchers in product verification and study.

FDA Label Image

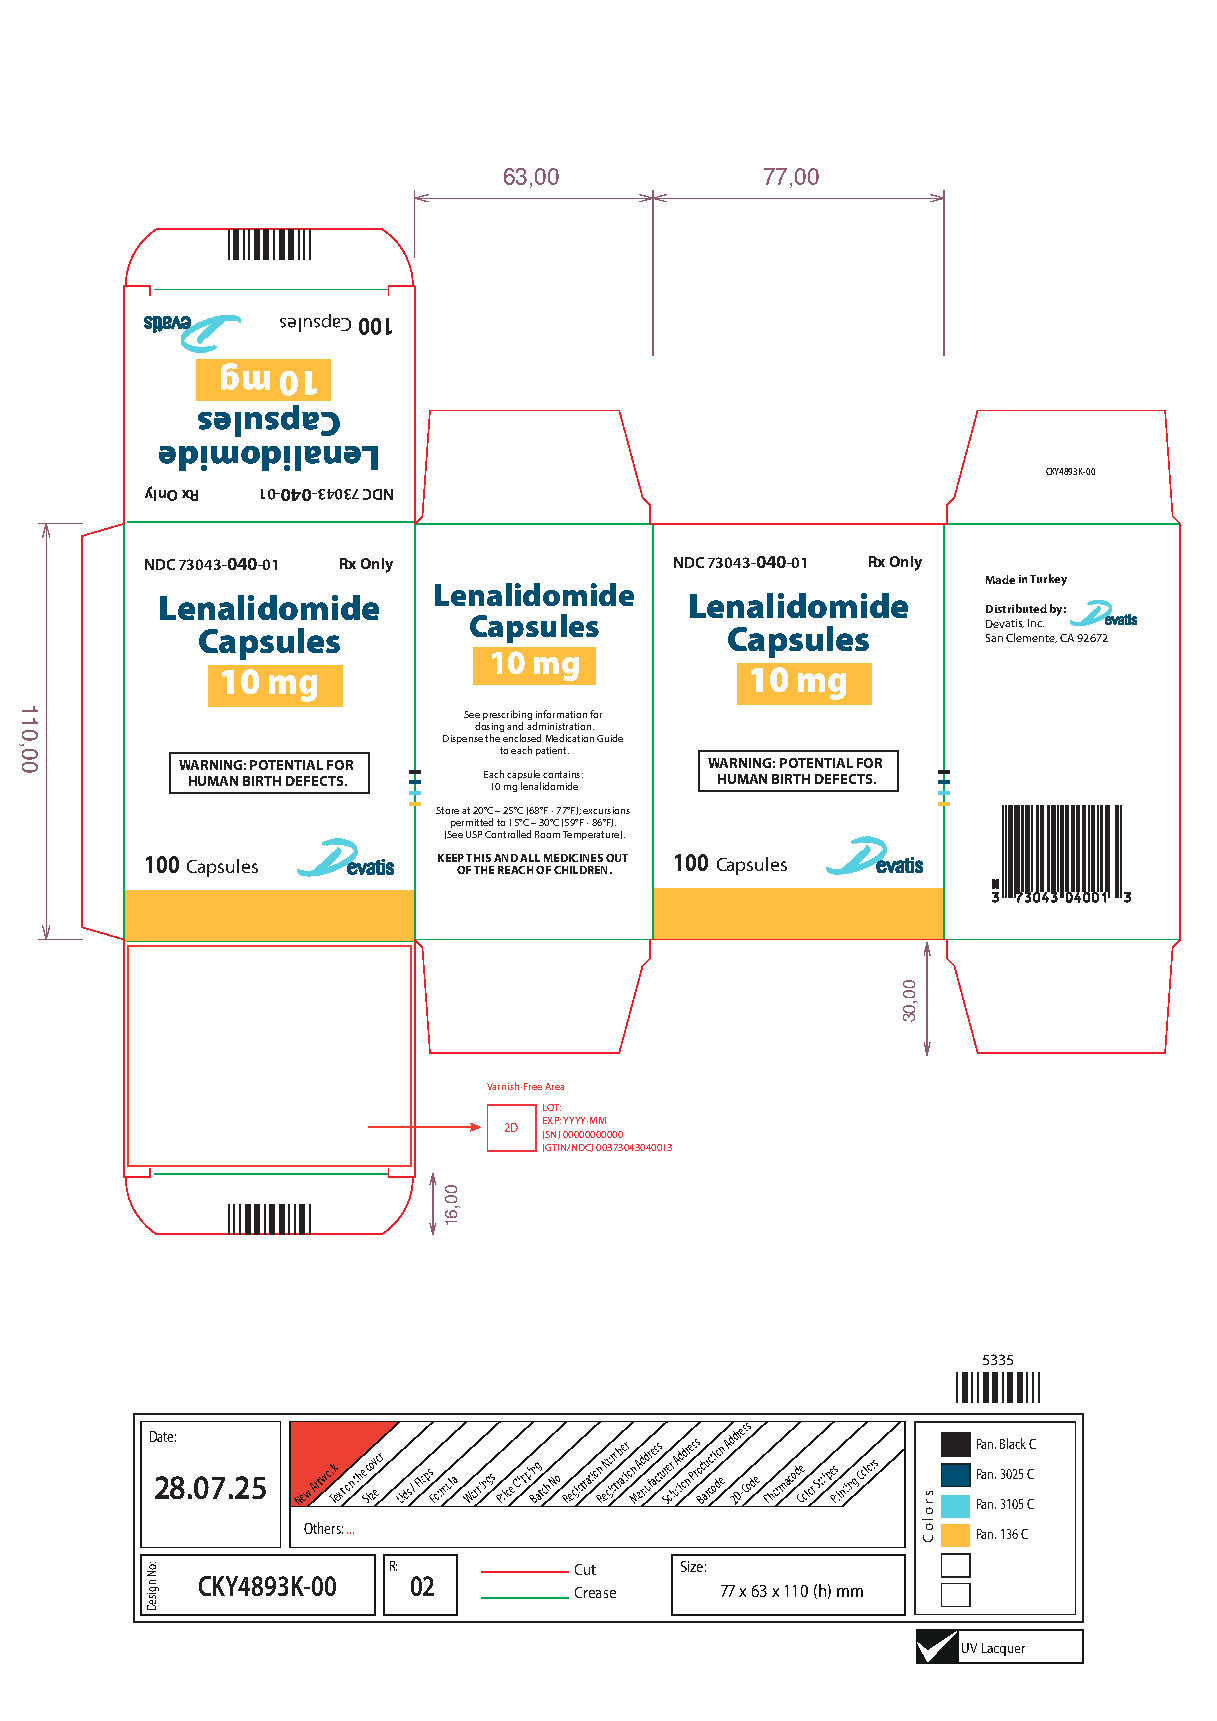
10mg-100capsules (10mg 100caps)
10mg-100capsules (10mg 100caps)
Packaging label for Lenalidomide Capsules 10 mg by Devatis Inc. The label displays the product name and strength prominently with warnings about potential human birth defects. It indicates a count of 100 capsules and includes storage information and prescription-only status. The label also notes the product is made in Turkey and distributed by Devatis Inc., San Clemente, CA.*
FDA Label Image

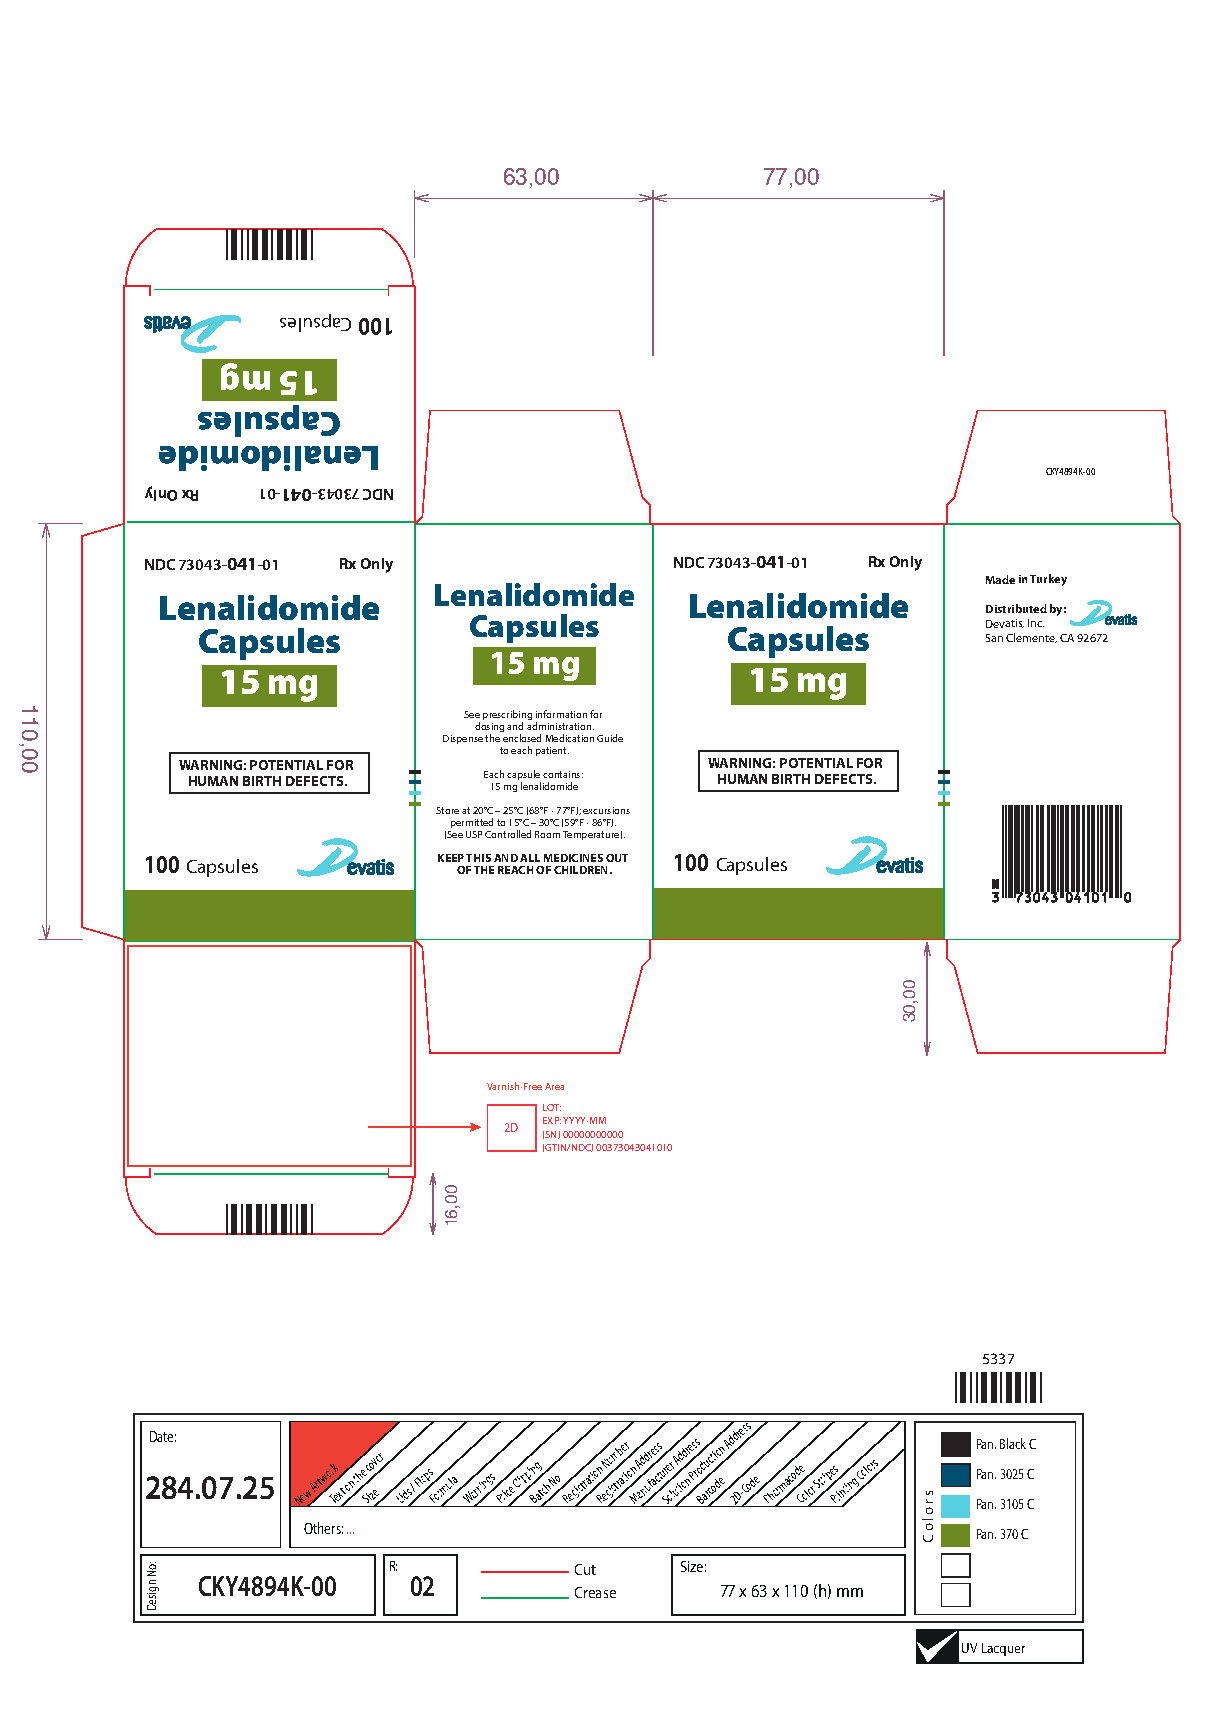
15mg-100capsules (15mg 100caps)

15mg-100capsules (15mg 100caps)
Packaging label for Lenalidomide Capsules 15 mg by Devatis Inc. The label indicates a quantity of 100 capsules. It includes warnings about potential human birth defects, storage instructions, and contact information indicating the product is made in Turkey and distributed by Devatis Inc. The label also features the NDC code 73043-041-01 and multiple barcodes.*
FDA Label Image

2_5mg-100capsules (2 5mg 100caps)

2_5mg-100capsules (2 5mg 100caps)
Packaging label for Lenalidomide Capsules 2.5 mg by Devatis Inc. The label indicates a quantity of 100 capsules and includes warnings about potential human birth defects. The label includes prescribing and storage information, a barcode, and states the product is made in Turkey and distributed by Devatis Inc., San Clemente, CA.*
FDA Label Image

20mg-100capsules (20mg 100caps)

20mg-100capsules (20mg 100caps)
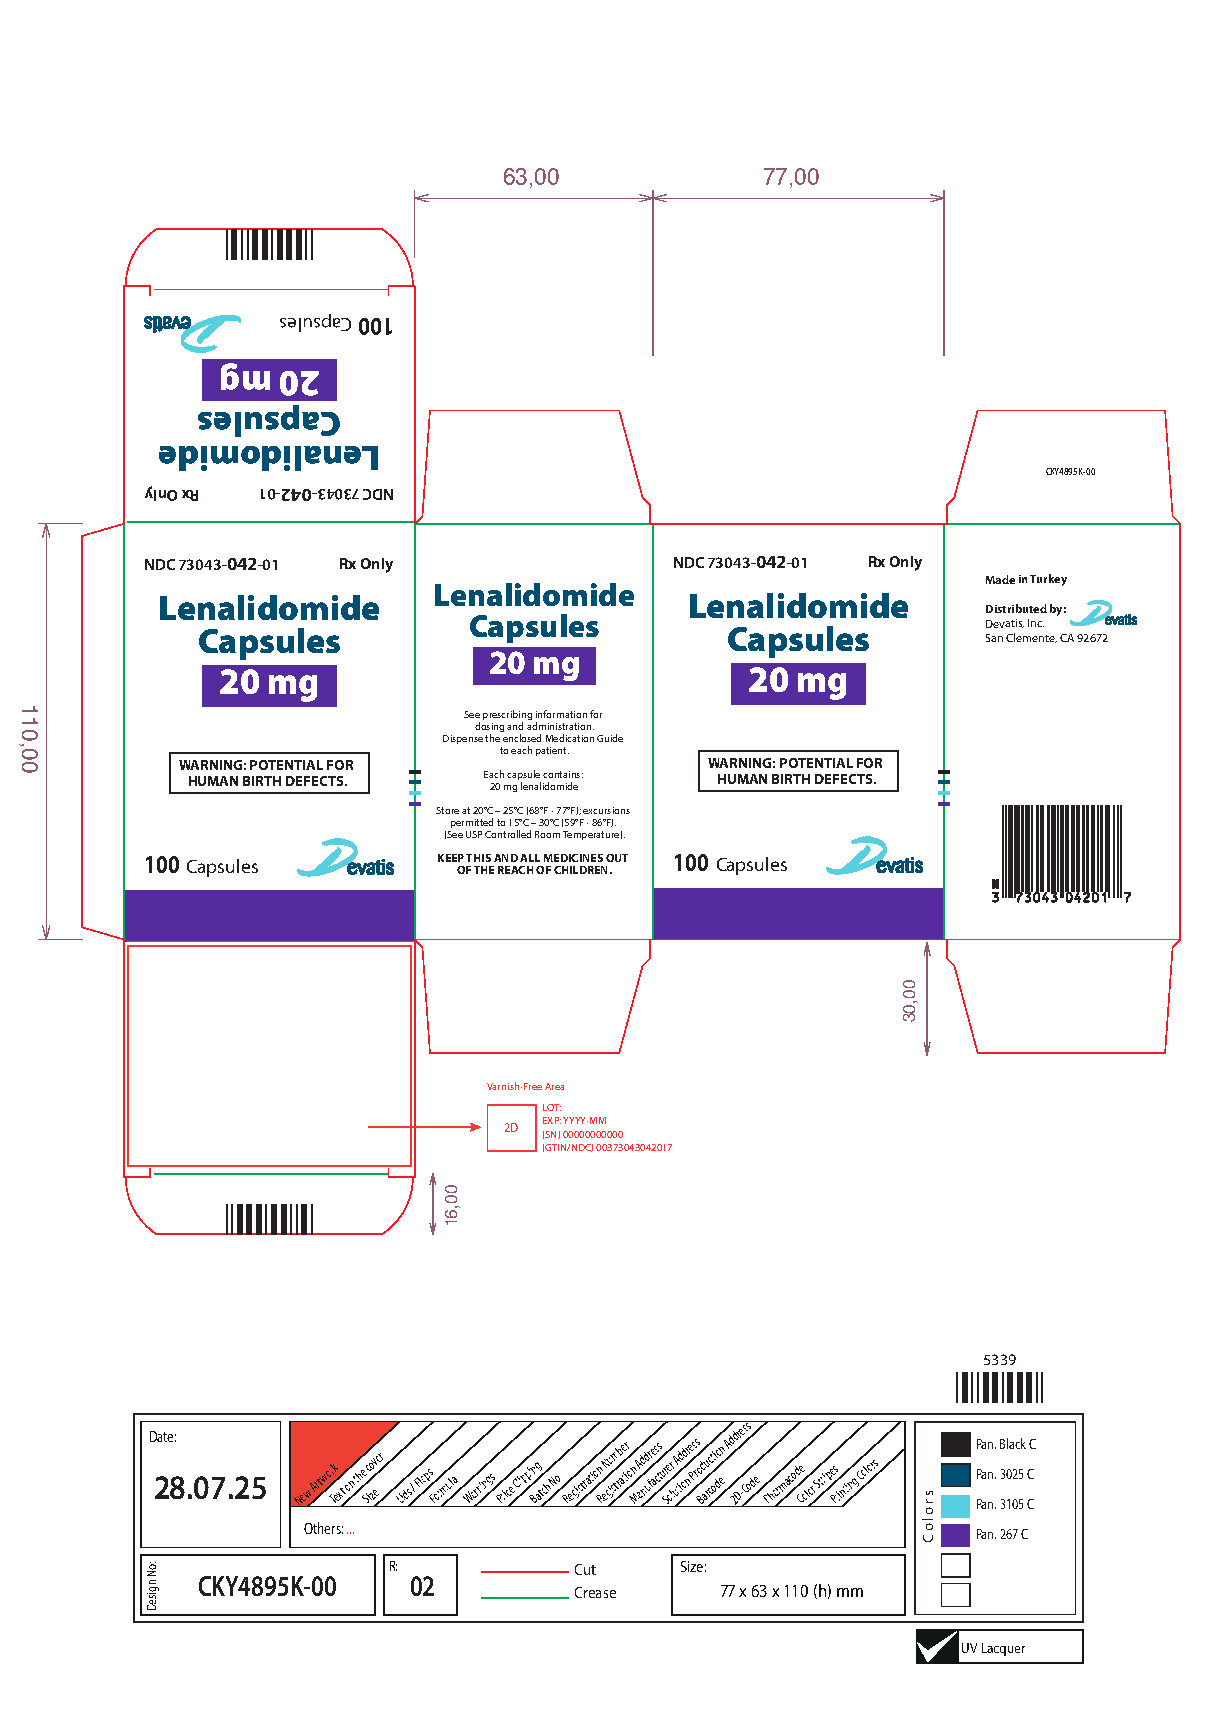
Packaging label for Lenalidomide Capsules 20 mg by Devatis Inc. The label includes the drug name, strength, capsule count of 100, and repeated warnings about potential human birth defects. It also states storage instructions and the product is made in Turkey. The label features the NDC number 73043-042-01 and distributor information for Devatis Inc., San Clemente, CA.*
FDA Label Image

25mg-100capsules (25mg 100caps)

25mg-100capsules (25mg 100caps)
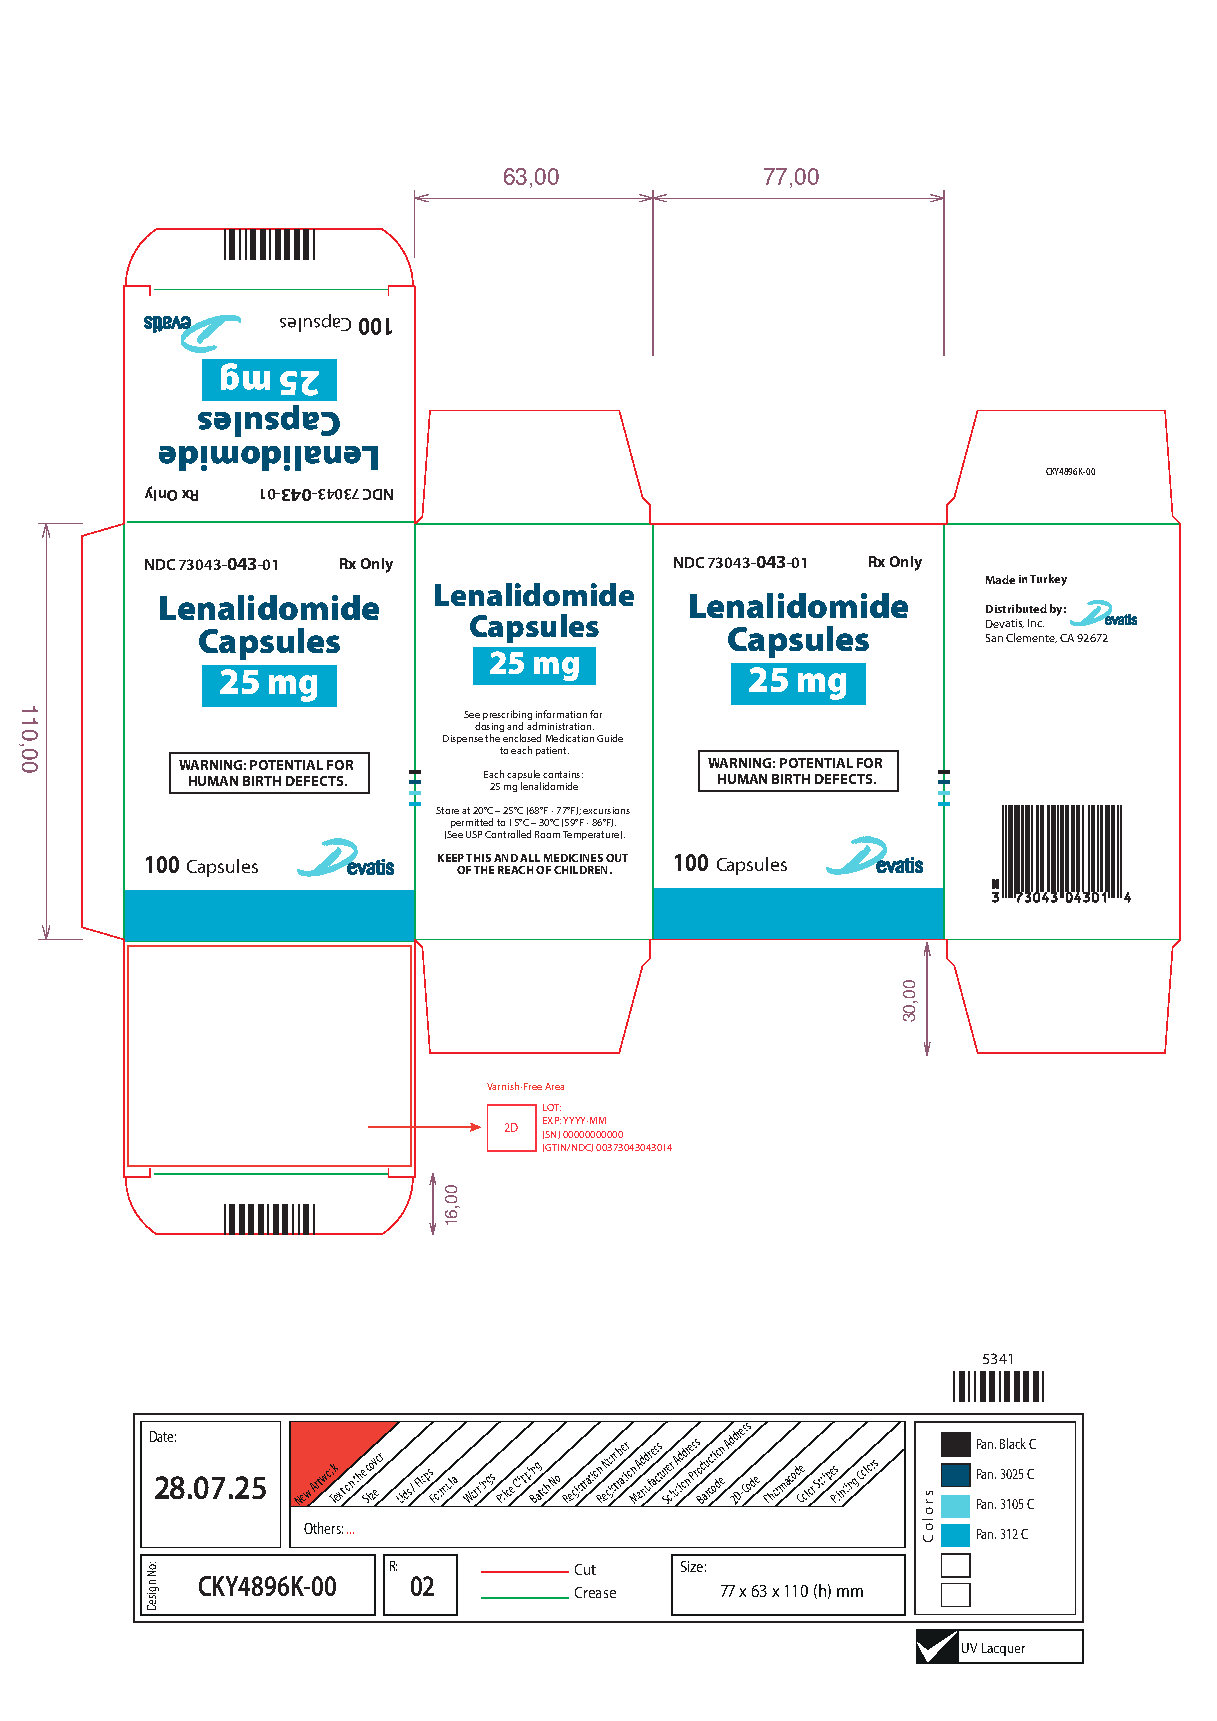
Packaging label for Lenalidomide 25 mg capsules by Devatis Inc. The label states the product contains 100 capsules and includes warnings about potential human birth defects. It shows the NDC number 73043-043-01, mentions it is for prescription use only, and includes storage instructions and a barcode. The label also notes the product is made in Turkey and distributed by Devatis Inc., San Clemente, CA.*
FDA Label Image

5mg-100capsules (5mg 100caps)

5mg-100capsules (5mg 100caps)
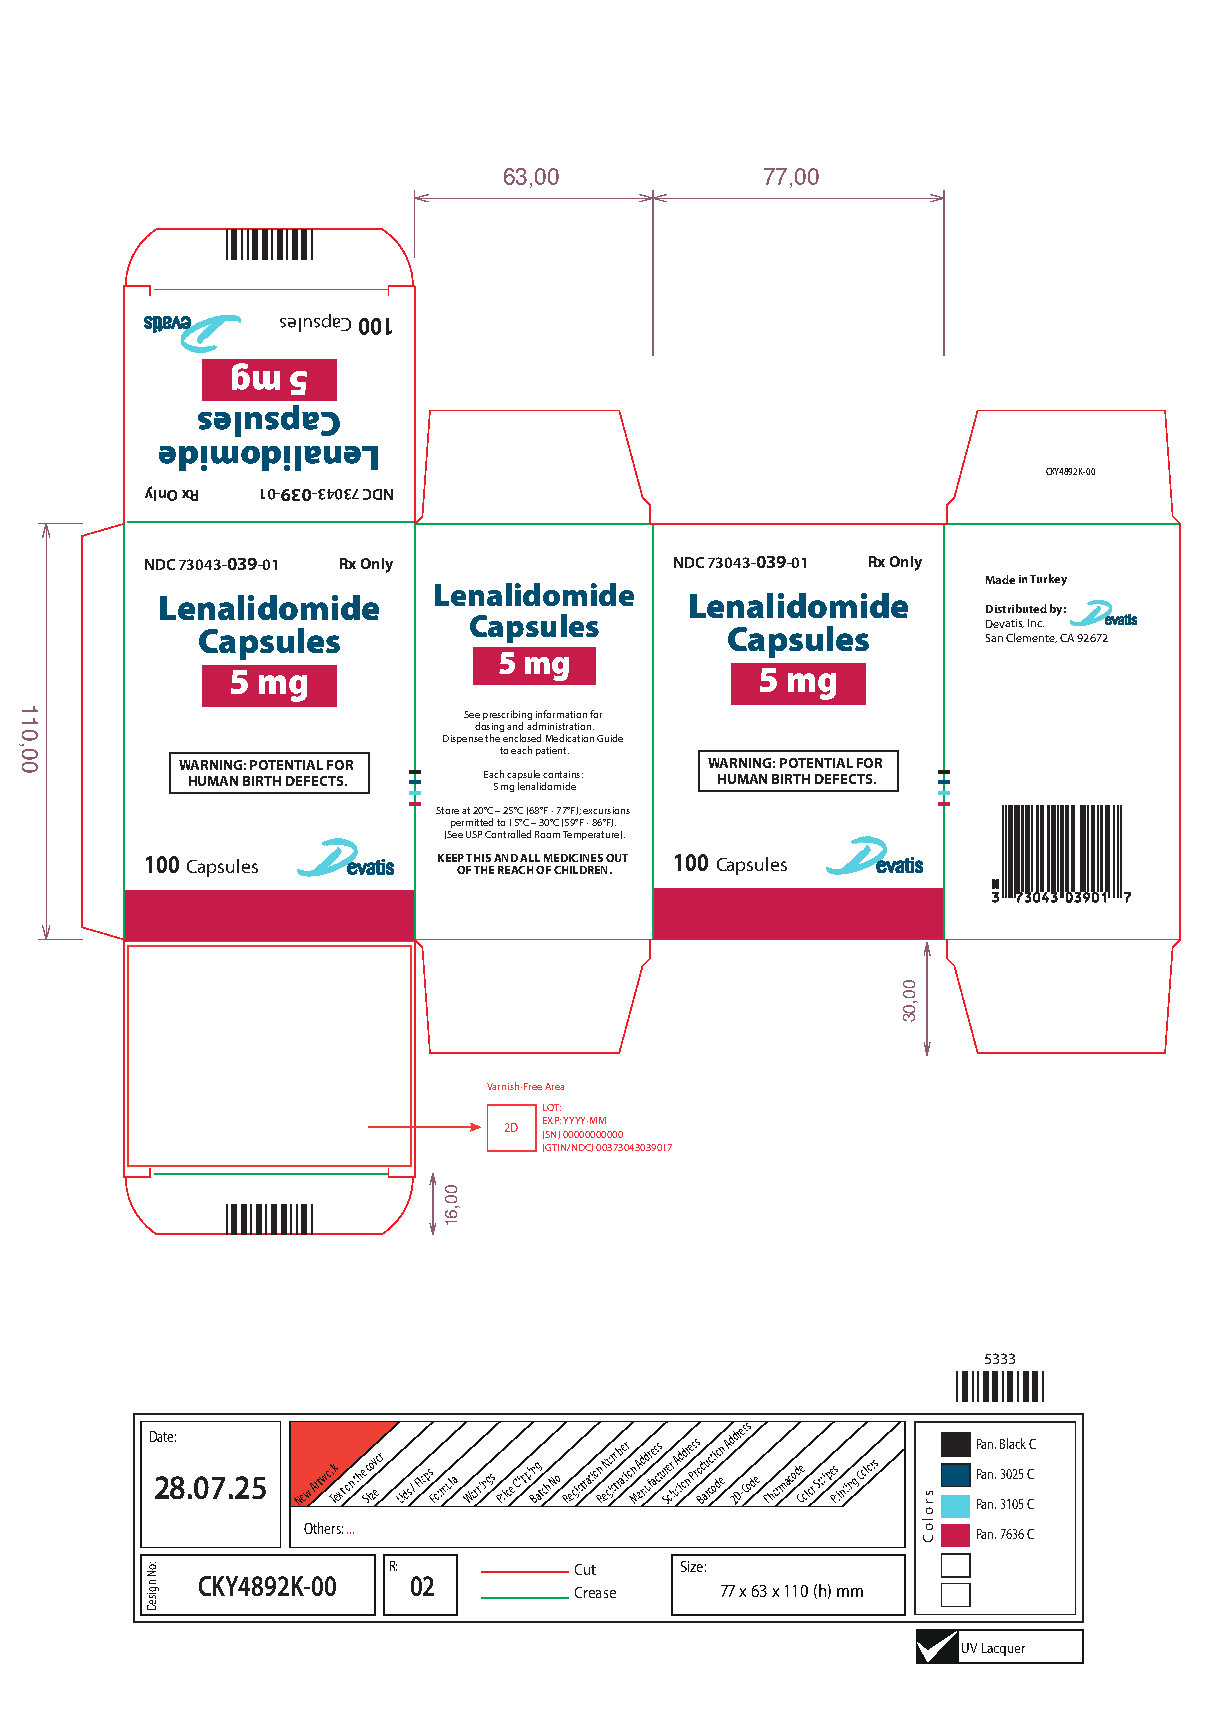
Packaging label for Lenalidomide Capsules 5 mg by Devatis Inc. The label indicates the package contains 100 oral capsules. Prominent warnings about potential human birth defects appear, along with storage instructions. The label also mentions that it is made in Turkey and distributed by Devatis Inc. in San Clemente, CA.*
FDA Label Image

Chemical Structure (Image 01)

Chemical Structure (Image 01)
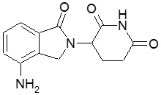
Chemical structure of Lenalidomide, showing its molecular framework with labeled functional groups and rings.*
FDA Label Image

Figure 1 (Image 02)

Figure 1 (Image 02)
A Kaplan-Meier progression-free survival curve comparing three treatment groups labeled Rd Continuous, Rd18, and MPT over a period of up to 60 months. The y-axis shows survival probability as a percentage, and the x-axis shows time in months. A data table beneath the graph shows the number of subjects at risk at various time points, along with event counts for each group. Additional statistics including hazard ratios with confidence intervals and a logrank p-value are presented within the plot area.*
FDA Label Image

Figure 2 (Image 03)

Figure 2 (Image 03)
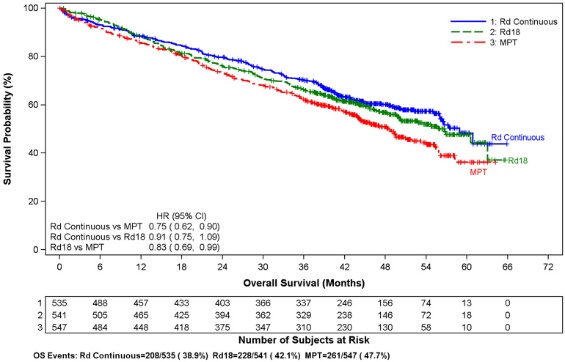
A survival probability Kaplan-Meier curve chart depicting overall survival over months for Lenalidomide treatment groups: Rd Continuous, Rd18, and MPT. The chart includes hazard ratios with 95% confidence intervals comparing these groups, alongside the number of subjects at risk at various time points up to 72 months.*
FDA Label Image

Figure 3 (Image 04)

Figure 3 (Image 04)
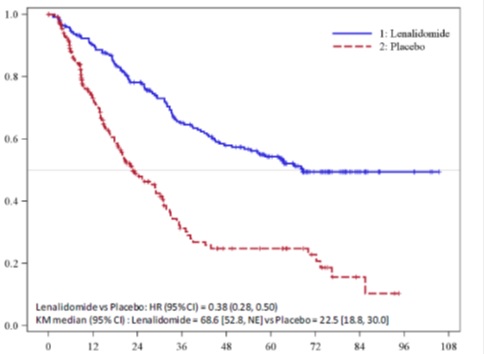
A Kaplan-Meier survival curve chart comparing Lenalidomide versus placebo over time. The chart shows two lines representing survival probabilities for the Lenalidomide group and the placebo group, with a legend identifying each line. Additional statistical values including hazard ratio and median survival times with confidence intervals are displayed below the graph.*
FDA Label Image

Figure 3a (Image 04a)

Figure 3a (Image 04a)
A data table showing two rows of numerical values with no headings or labels. The numbers decrease sequentially across the columns, presented in a simple grid format without additional context or explanation.*
FDA Label Image

Figure 4 (Image 05)

Figure 4 (Image 05)
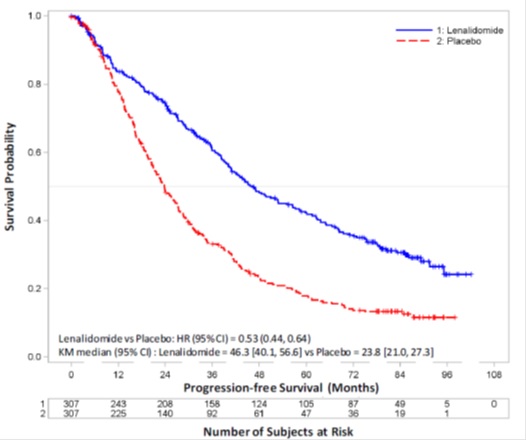
Kaplan-Meier progression-free survival curve comparing Lenalidomide versus placebo over months. The chart shows survival probability on the Y-axis and time in months on the X-axis. The Lenalidomide group (blue solid line) demonstrates higher survival probability compared to the placebo group (red dashed line), with numerical data for number of subjects at risk displayed below the X-axis.*
FDA Label Image

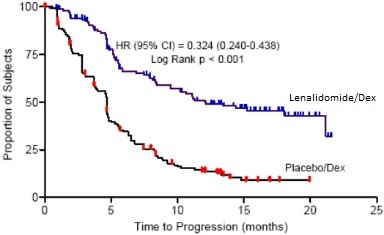
Figure 5 (Image 06)

Figure 5 (Image 06)
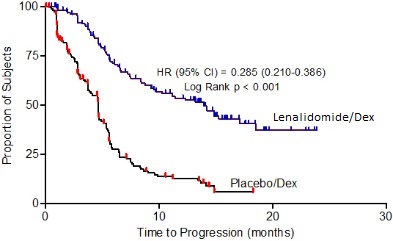
A Kaplan-Meier survival plot depicting the proportion of subjects over time to progression in months. The chart compares two groups: Lenalidomide/Dex and Placebo/Dex, showing significantly better progression-free survival for the Lenalidomide/Dex group, with hazard ratio (HR) and confidence interval (CI) data included.*
FDA Label Image

Figure 6 (Image 07)

Figure 6 (Image 07)
A Kaplan-Meier curve graph displaying time to progression in months on the x-axis and proportion of subjects on the y-axis. Two treatment groups are compared: Lenalidomide/Dex and Placebo/Dex, showing a higher proportion of subjects without progression over time in the Lenalidomide/Dex group. The chart includes a hazard ratio (HR) with 95% confidence interval and a log-rank p-value.*
FDA Label Image

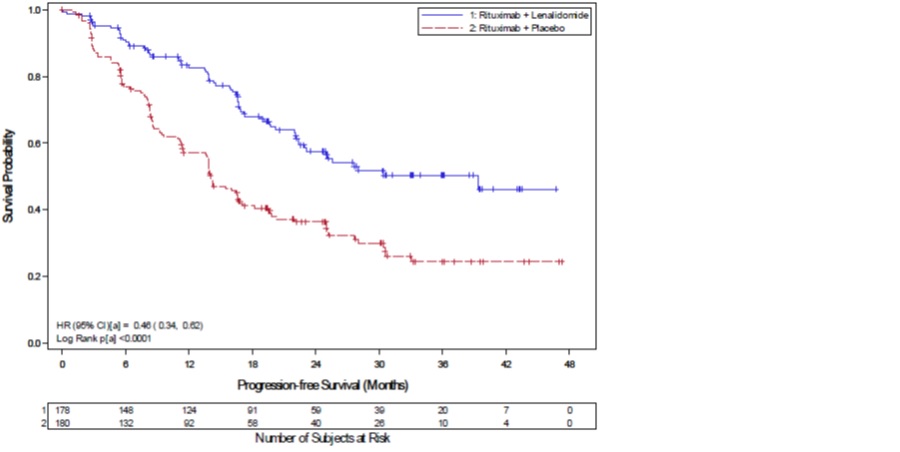
Figure 7 (Image 08)

Figure 7 (Image 08)
A Kaplan-Meier survival curve chart showing survival probability over progression-free survival months for two treatment groups: Rituximab combined with Lenalidomide versus Rituximab with Placebo. The graph includes survival probability on the vertical axis and time in months on the horizontal axis, with numbers of subjects at risk listed below the timeline.*

* About these descriptions: Image descriptions on this page are generated by automated AI analysis of the product label images from the manufacturer's FDA label submission (SPL). They are provided for reference only and may contain errors or omissions. Always rely on the printed label itself and the official FDA labeling, and consult a pharmacist or healthcare professional with any questions about this product.