Ticagrelor Tablet
Product Images NDC 73190-008

View Photos of Packaging, Regulatory Labels, and Product Appearance

Product Visual Gallery

This gallery contains 20 technical images submitted to the FDA as part of the official labeling for Ticagrelor (NDC 73190-008). Unlike standard consumer photos, these assets often include clinical data figures, molecular chemical structures, and official manufacturer packaging layouts.

As provided by Avkare, these visuals offer a comprehensive scientific overview of the product's physical and chemical identity, aiding pharmacists and researchers in product verification and study.

FDA Label Image

1 (008 60)

1 (008 60)
Label for Ticagrelor Tablets 90 mg by AvKARE showing the dosage strength and count of 60 tablets. The label includes storage instructions, manufacturer information (MSN Pharmaceuticals Inc.), and a warning to keep out of reach of children. It also contains barcode and NDC number 73190-008-60.*
FDA Label Image

Tica-tabs-fig-01 (Tica Tabs Fig 01)

Tica-tabs-fig-01 (Tica Tabs Fig 01)
Kaplan-Meier cumulative incidence graph comparing Ticagrelor 90 mg and Clopidogrel over 360 days. The Y-axis shows cumulative percentage of patients with events, and the X-axis shows days from the first study drug dose. The chart includes number of patients at risk and events for each drug at various time points.*
FDA Label Image

Tica-tabs-fig-02 (Tica Tabs Fig 02)

Tica-tabs-fig-02 (Tica Tabs Fig 02)
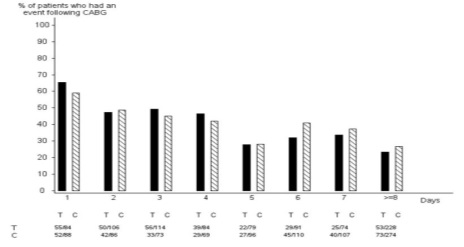
A bar chart comparing the percentage of patients who had an event following CABG over a series of days. The x-axis is labeled with days, and the y-axis shows percentage values. Two categories, labeled T and C, are shown with different bar styles for each day group.*
FDA Label Image

Tica-tabs-fig-03 (Tica Tabs Fig 03)

Tica-tabs-fig-03 (Tica Tabs Fig 03)
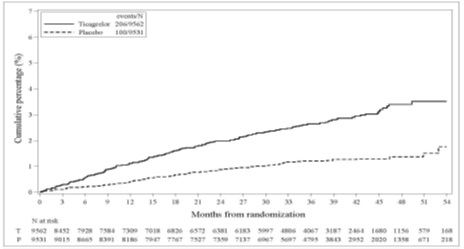
A line graph depicting cumulative percentage over time in months from randomization, comparing ticagrelor and placebo groups. The ticagrelor group is represented by a solid line and shows a consistently higher cumulative percentage than the placebo group, represented by a dashed line, across the 54-month period.*
FDA Label Image

Tica-tabs-fig-04 (Tica Tabs Fig 04)

Tica-tabs-fig-04 (Tica Tabs Fig 04)
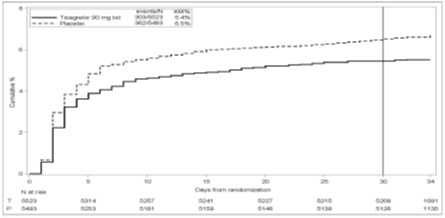
A Kaplan-Meier cumulative event curve comparing Ticagrelor 90 mg twice daily versus placebo over approximately 34 days, showing event rates on the y-axis and days from randomization on the x-axis. The graph includes patient counts at risk below the x-axis.*
FDA Label Image

Tica-tabs-fig-05 (Tica Tabs Fig 05)

Tica-tabs-fig-05 (Tica Tabs Fig 05)
A line graph comparing the platelet reactivity index (PRI) inhibition over time for Ticagrelor 180 mg, Clopidogrel 600 mg, and placebo. The x-axis represents time in hours, and the y-axis shows PRI as a percentage, demonstrating the relative effectiveness of each treatment over an 8-hour period.*
FDA Label Image

Tica-tabs-fig-06 (Tica Tabs Fig 06)

Tica-tabs-fig-06 (Tica Tabs Fig 06)
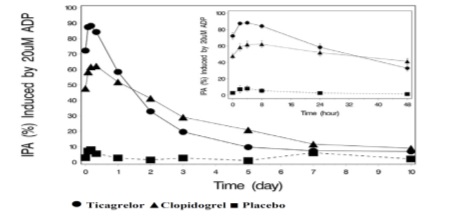
A line graph comparing platelet aggregation inhibition (IPA %) over time between Ticagrelor, Clopidogrel, and Placebo groups. The main graph shows IPA over days, with Ticagrelor showing higher inhibition initially. An inset graph displays platelet aggregation inhibition over hours following 20 µM ADP stimulation, with Ticagrelor demonstrating a rapid and sustained effect compared to Clopidogrel and Placebo.*
FDA Label Image

Tica-tabs-fig-07 (Tica Tabs Fig 07)

Tica-tabs-fig-07 (Tica Tabs Fig 07)
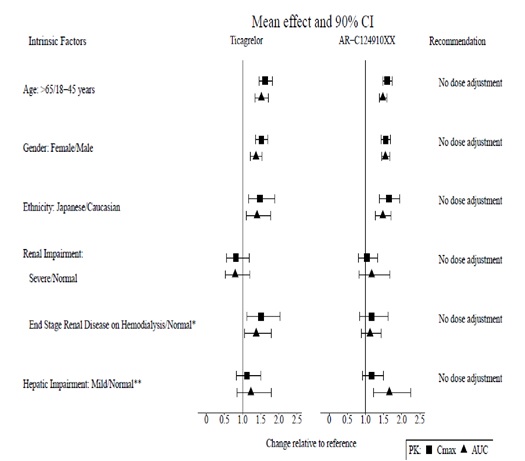
A chart titled 'Mean effect and 90% CI' comparing intrinsic factors' effects on ticagrelor and AR-C124910XX, showing data for age, gender, ethnicity, renal impairment, end-stage renal disease, and hepatic impairment. The graph plots changes relative to reference values with mean and 90% confidence intervals, along with dosage adjustment recommendations, all indicating no dose adjustment needed.*
FDA Label Image

Tica-tabs-fig-08 (Tica Tabs Fig 08)

Tica-tabs-fig-08 (Tica Tabs Fig 08)
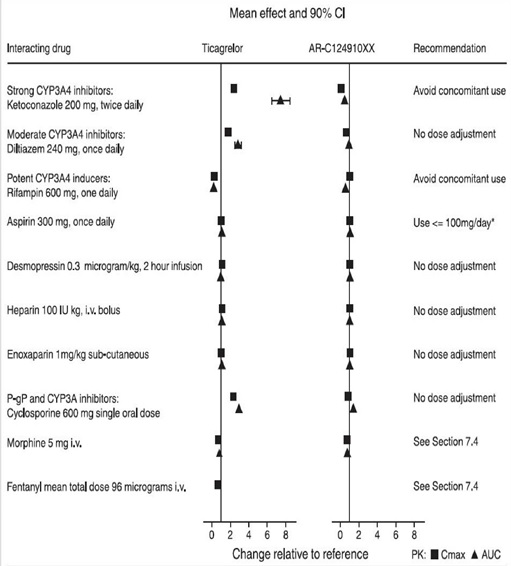
A horizontal scatter plot showing the mean effect and 90% confidence interval (CI) for various interacting drugs with Ticagrelor and AR-C124910XX related to pharmacokinetic parameters PK, Cmax, and AUC. The graph includes drugs such as ketoconazole, diltiazem, rifampin, aspirin, desmopressin, heparin, enoxaparin, cyclosporine, morphine, and fentanyl, alongside recommendations like dose adjustments and avoidance of concomitant use.*
FDA Label Image

Tica-tabs-fig-09 (Tica Tabs Fig 09)

Tica-tabs-fig-09 (Tica Tabs Fig 09)
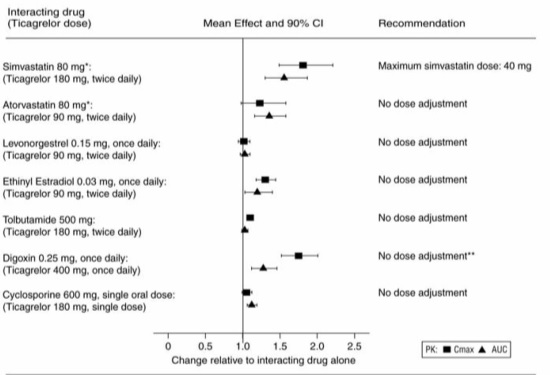
A plot showing the interaction effects of various drugs with different doses of Ticagrelor. The horizontal axis represents change relative to the interacting drug alone, with mean effects and 90% confidence intervals displayed for each drug combination. Recommendations for dose adjustments are provided to the right of the graph.*
FDA Label Image

Tica-tabs-fig-10 (Tica Tabs Fig 10)

Tica-tabs-fig-10 (Tica Tabs Fig 10)
A Kaplan-Meier cumulative incidence curve comparing the effect of Ticagrelor 90 mg and Clopidogrel over 360 days. The x-axis shows days from randomization, and the y-axis shows cumulative percentage. The chart includes patient event counts and hazard ratio data in a table within the image.*
FDA Label Image

Tica-tabs-fig-11 (Tica Tabs Fig 11)

Tica-tabs-fig-11 (Tica Tabs Fig 11)
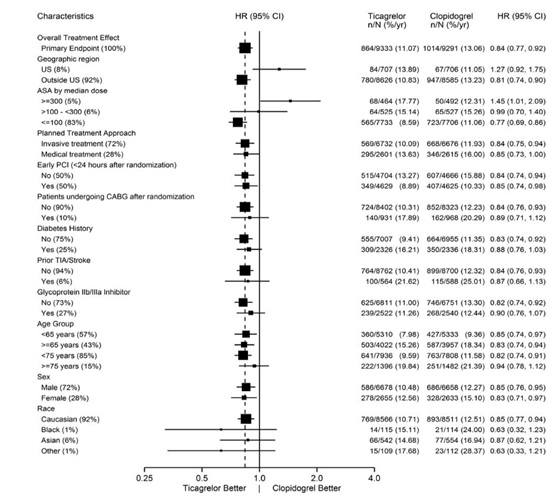
This is a forest plot comparing the overall treatment effect of Ticagrelor versus Clopidogrel across various subgroups, including geographic region, ASA median dose, treatment approach, PCI timing, diabetes history, prior stroke, and demographic factors such as age, sex, and race. The horizontal axis represents the hazard ratio (HR) with 95% confidence intervals, showing effectiveness favoring either Ticagrelor or Clopidogrel.*
FDA Label Image

Tica-tabs-fig-12 (Tica Tabs Fig 12)

Tica-tabs-fig-12 (Tica Tabs Fig 12)
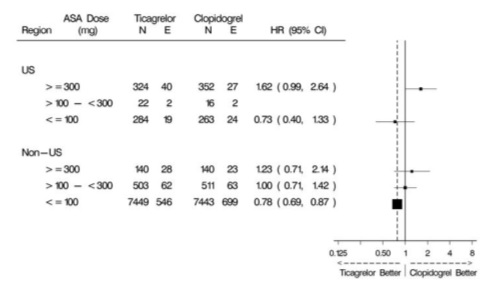
A data table presenting clinical trial results comparing Ticagrelor and Clopidogrel at various aspirin doses (>=300 mg, >100 to <300 mg, <=100 mg) for US and Non-US regions. It lists sample sizes (N), events (E), and hazard ratios (HR) with 95% confidence intervals, accompanied by a forest plot illustrating comparative effectiveness between Ticagrelor and Clopidogrel.*
FDA Label Image

Tica-tabs-fig-13 (Tica Tabs Fig 13)

Tica-tabs-fig-13 (Tica Tabs Fig 13)
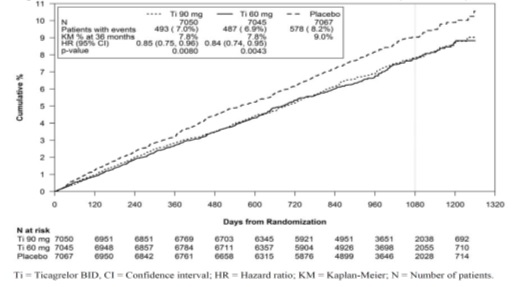
A Kaplan-Meier cumulative incidence curve comparing TICAGRELOR 90 mg BID and placebo groups over approximately 1,320 days from randomization. The graph plots cumulative event percentages with survival analysis metrics and patient counts at risk displayed at various time points.*
FDA Label Image

Tica-tabs-fig-14 (Tica Tabs Fig 14)

Tica-tabs-fig-14 (Tica Tabs Fig 14)
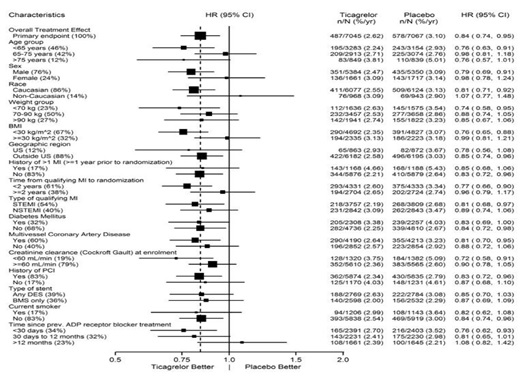
A forest plot chart comparing outcomes between Ticagrelor and placebo across various patient subgroups, displaying hazard ratios (HR) with 95% confidence intervals (CI). The chart shows the number of events per number of patients for both Ticagrelor and placebo, grouped by characteristics such as age, sex, race, BMI, history of MI, diabetes, and others, with HRs plotted to indicate treatment effect.*
FDA Label Image

Tica-tabs-fig-15 (Tica Tabs Fig 15)

Tica-tabs-fig-15 (Tica Tabs Fig 15)
A Kaplan-Meier curve showing cumulative percentage over months from randomization comparing Ticagrelor and Placebo groups. The graph plots cumulative percentage events on the y-axis against months from randomization on the x-axis, with Ticagrelor represented by a solid line and Placebo by a dashed line. The number at risk for each group is displayed beneath the x-axis.*
FDA Label Image

Tica-tabs-fig-16 (Tica Tabs Fig 16)

Tica-tabs-fig-16 (Tica Tabs Fig 16)
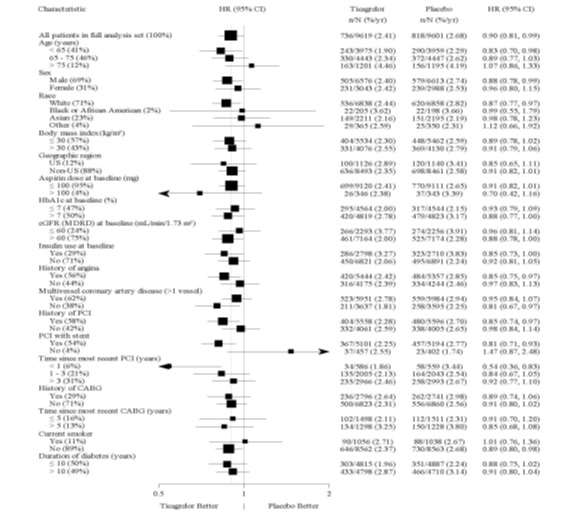
A forest plot showing hazard ratios (HR) with 95% confidence intervals for various patient subgroups comparing Ticagrelor 90 mg tablets to placebo. Variables include age, sex, race, body mass index, region, baseline HbA1c and insulin use, history of angina, coronary artery disease, PCI, CABG, smoking, and diabetes duration. The plot visualizes treatment effect differences across these subpopulations.*
FDA Label Image

Tica-tabs-fig-17 (Tica Tabs Fig 17)

Tica-tabs-fig-17 (Tica Tabs Fig 17)
A Kaplan-Meier survival curve chart comparing Ticagrelor 90 mg tablet and placebo groups over time. The x-axis represents days from randomization up to 34 days, while the y-axis shows the cumulative percentage of events. The chart includes risk tables below the curves showing the number of subjects at risk at various time points for each group.*
FDA Label Image

Tica-tabs-fig-18 (Tica Tabs Fig 18)

Tica-tabs-fig-18 (Tica Tabs Fig 18)
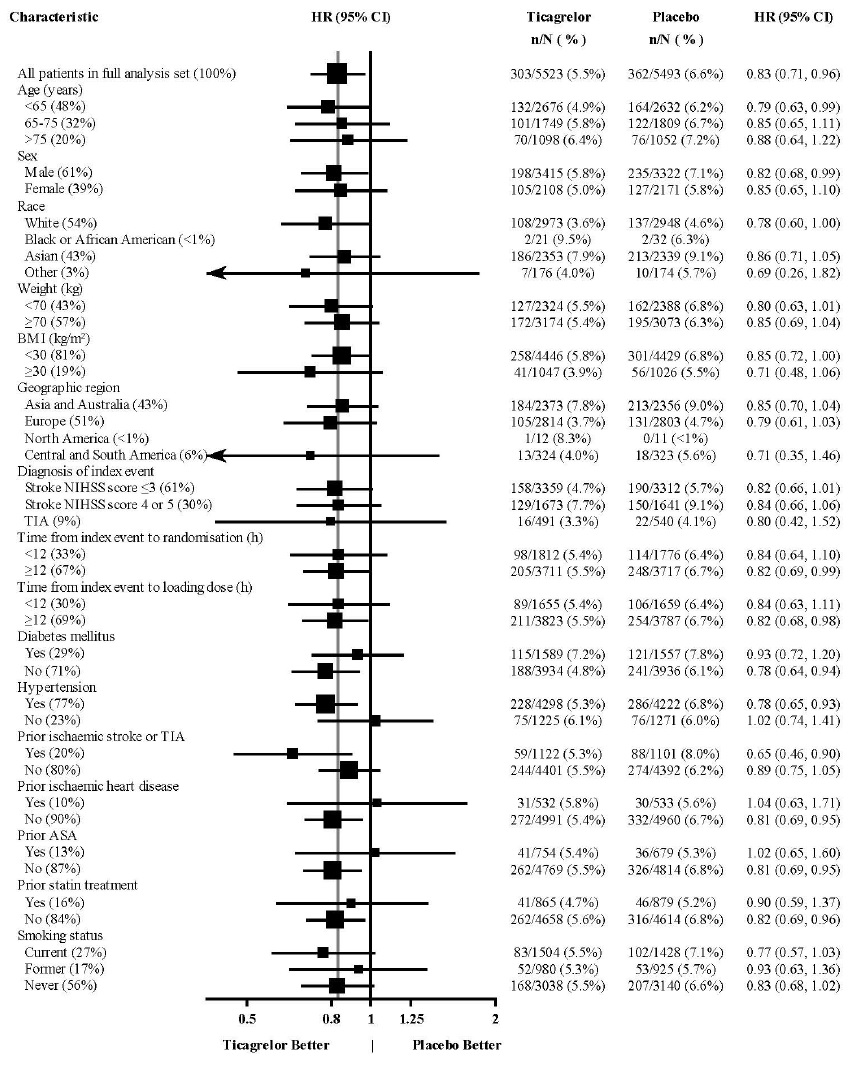
A forest plot chart showing hazard ratios (HR) with 95% confidence intervals for Ticagrelor versus placebo across various patient characteristics, including age, sex, race, weight, BMI, geographic region, diagnosis, time from index event to randomization and loading dose, diabetes, hypertension, prior ischemic events, statin treatment, and smoking status. The plot compares event rates (%) for Ticagrelor and placebo groups, with markers indicating the direction and magnitude of effect.*
FDA Label Image

Tica-tabs-structure (Tica Tabs Structure)

Tica-tabs-structure (Tica Tabs Structure)
Chemical structure of the active ingredient Ticagrelor, depicted as a molecular diagram showing its atomic arrangement and bonds.*

* About these descriptions: Image descriptions on this page are generated by automated AI analysis of the product label images from the manufacturer's FDA label submission (SPL). They are provided for reference only and may contain errors or omissions. Always rely on the printed label itself and the official FDA labeling, and consult a pharmacist or healthcare professional with any questions about this product.