Dapagliflozin Tablet, Film Coated
Product Images NDC 73190-073

View Photos of Packaging, Regulatory Labels, and Product Appearance

Product Visual Gallery

This gallery contains 11 technical images submitted to the FDA as part of the official labeling for Dapagliflozin (NDC 73190-073). Unlike standard consumer photos, these assets often include clinical data figures, molecular chemical structures, and official manufacturer packaging layouts.

As provided by Avkare, these visuals offer a comprehensive scientific overview of the product's physical and chemical identity, aiding pharmacists and researchers in product verification and study.

FDA Label Image

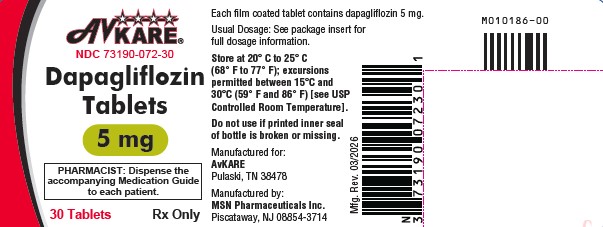
1 (072 30)

1 (072 30)
Dapagliflozin 5 mg film-coated tablets package label by AvKARE. The label features the brand name and strength prominently, notes that there are 30 tablets per bottle, and includes dispensing instructions for pharmacists. Storage instructions and manufacturing details by MSN Pharmaceuticals Inc. are also visible. The label indicates the product is prescription only.*
FDA Label Image

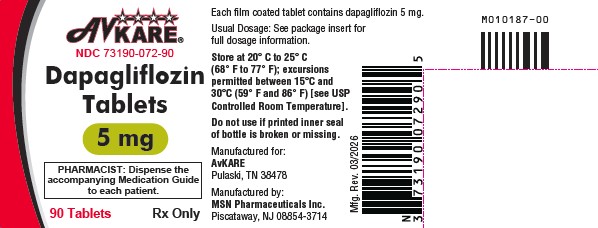
1 (072 90)

1 (072 90)
Dapagliflozin 5 mg film-coated tablets in a packaging label from AvKARE. The label indicates a package contains 90 tablets for oral use, with dispensing instructions for pharmacists and storage temperature guidelines. The product is manufactured for AvKARE by MSN Pharmaceuticals.*
FDA Label Image

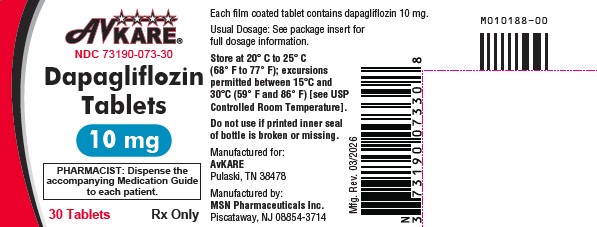
1 (073 30)

1 (073 30)
Dapagliflozin 10 mg film-coated tablets label by AvKARE. The container holds 30 tablets, Rx only. The label provides storage instructions to keep the product between 20°C to 25°C with permitted excursions and advises dispensing the accompanying Medication Guide to patients. Manufactured by MSN Pharmaceuticals Inc., Piscataway, NJ.*
FDA Label Image

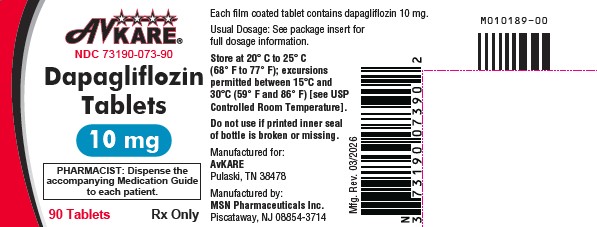
1 (073 90)

1 (073 90)
Dapagliflozin 10 mg film-coated tablets packaging label by AvKARE. The label indicates a bottle containing 90 tablets and includes storage instructions and manufacturer information. The label states the product is prescription only and emphasizes dispensing an accompanying medication guide to patients.*
FDA Label Image

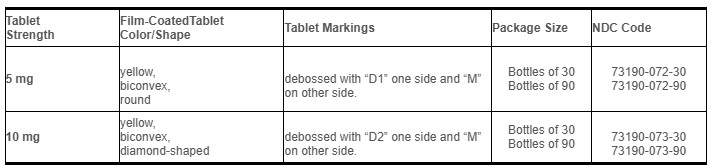
1 (Tablet Descriptions How Supplied)

1 (Tablet Descriptions How Supplied)
A data table listing Dapagliflozin film-coated tablet details by strength. The 5 mg tablets are yellow, biconvex, round, debossed with 'D1' and 'M', available in bottles of 30 or 90. The 10 mg tablets are yellow, biconvex, diamond-shaped, debossed with 'D2' and 'M', also in bottles of 30 or 90. NDC codes for each strength and packaging option are included.*
FDA Label Image

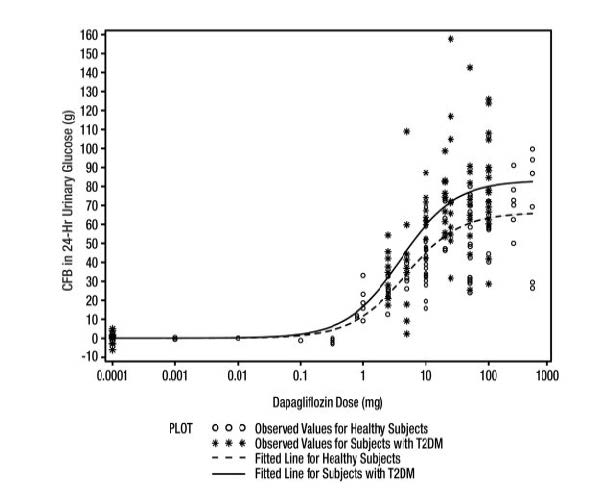
Fig1 (Dapagliflozin Figure 01)

Fig1 (Dapagliflozin Figure 01)
A scatter plot graph showing the relationship between dapagliflozin dose (mg) on the x-axis and CFB in 24-hr urinary glucose (g) on the y-axis. The plot includes observed values and fitted lines for healthy subjects and subjects with T2DM, depicting dose-response trends for both groups.*
FDA Label Image

Figure-02 (Dapagliflozin Figure 02)

Figure-02 (Dapagliflozin Figure 02)
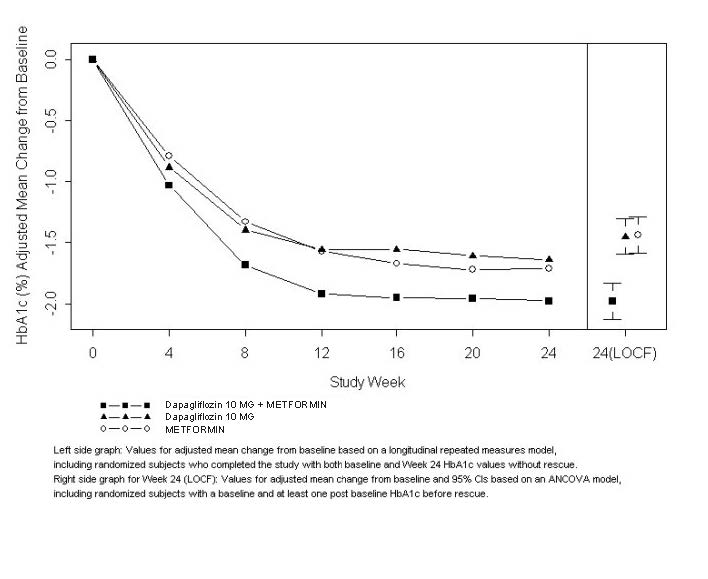
A line graph showing adjusted mean change from baseline in HbA1c (%) over 24 weeks of study for Dapagliflozin 10 mg alone, Dapagliflozin 10 mg with Metformin, and Metformin alone. The graph includes a table with 95% confidence intervals for Week 24 (LOCF) values, illustrating comparative effects on HbA1c reduction across treatment groups.*
FDA Label Image

Fig-3 (Dapagliflozin Figure 03)

Fig-3 (Dapagliflozin Figure 03)
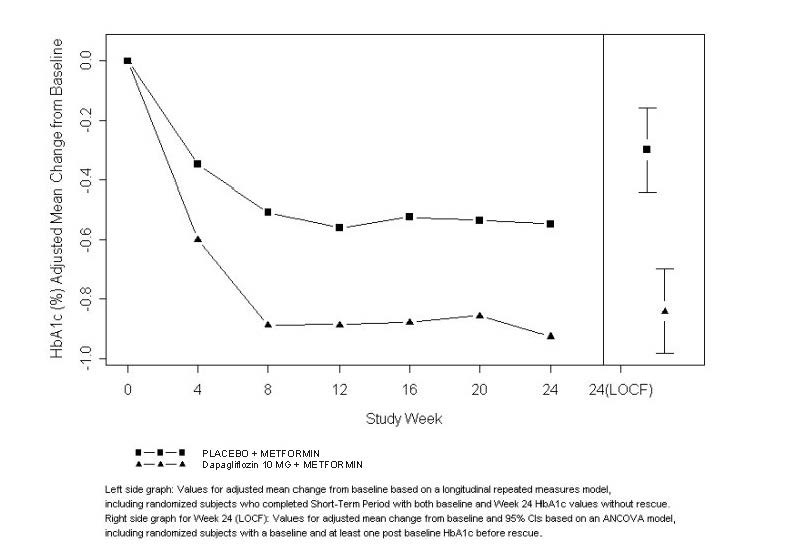
A line graph comparing HbA1c (%) adjusted mean change from baseline over a 24-week study period between two treatment groups: PLACEBO + METFORMIN and Dapagliflozin 10 mg + METFORMIN. The graph shows a greater reduction in HbA1c for the Dapagliflozin group across study weeks, with error bars representing 95% confidence intervals at week 24 (LOCF).*
FDA Label Image

Dapagliflozin-figure-04 (Dapagliflozin Figure 04)

Dapagliflozin-figure-04 (Dapagliflozin Figure 04)
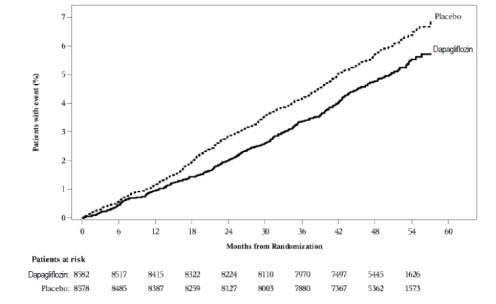
A line graph comparing the percentage of patients with events over a 60-month period between dapagliflozin and placebo groups. The x-axis represents months from randomization, and the y-axis shows the percentage of patients with events. Two lines illustrate event rates for dapagliflozin and placebo, with a patient risk table below for each group at various time points.*
FDA Label Image

Dapagliflozin-figure-05 (Dapagliflozin Figure 05)

Dapagliflozin-figure-05 (Dapagliflozin Figure 05)
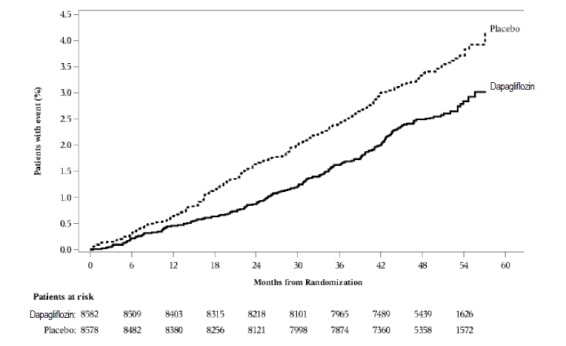
A line graph comparing the percentage of patients with events over 60 months between Dapagliflozin and Placebo groups. The x-axis shows months from randomization, and the y-axis shows the percentage of patients with events, with Dapagliflozin consistently showing a lower event rate than Placebo. A table below the graph lists the number of patients at risk at various time points for both groups.*
FDA Label Image

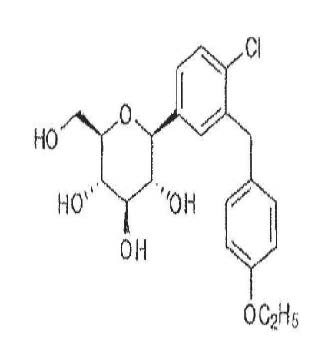
Str (Dapagliflozin Structure)

Str (Dapagliflozin Structure)
Chemical structure of dapagliflozin, which includes a chlorine-substituted phenyl ring, a sugar moiety with multiple hydroxyl groups, and an ethoxy-substituted phenyl ring.*

* About these descriptions: Image descriptions on this page are generated by automated AI analysis of the product label images from the manufacturer's FDA label submission (SPL). They are provided for reference only and may contain errors or omissions. Always rely on the printed label itself and the official FDA labeling, and consult a pharmacist or healthcare professional with any questions about this product.