Tizanidine Hydrochloride Capsule
Product Images NDC 73352-089

View Photos of Packaging, Regulatory Labels, and Product Appearance

Product Visual Gallery

This gallery contains 5 technical images submitted to the FDA as part of the official labeling for Tizanidine Hydrochloride (NDC 73352-089). Unlike standard consumer photos, these assets often include clinical data figures, molecular chemical structures, and official manufacturer packaging layouts.

As provided by Trifluent Pharma, Llc, these visuals offer a comprehensive scientific overview of the product's physical and chemical identity, aiding pharmacists and researchers in product verification and study.

FDA Label Image

Label-zfc2 (Label Zfc2)
Label-zfc2 (Label Zfc2)
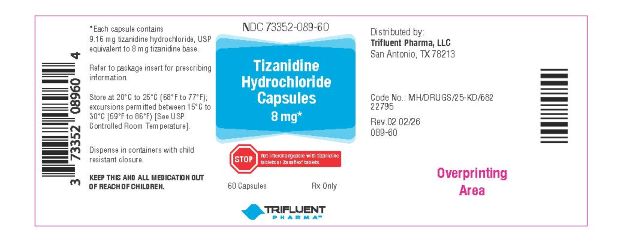
Label for Tizanidine Hydrochloride Capsules 8 mg from Trifluent Pharma, LLC, displaying dosage strength, packaging size of 60 capsules, storage instructions, and a child-resistant container warning. The label includes the product NDC 73352-089-60 and a caution to keep medication out of reach of children.*
FDA Label Image

Image Description (Zan01 0001 01a)

Image Description (Zan01 0001 01a)
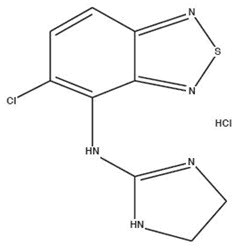
Chemical structure of tizanidine hydrochloride, showing the molecular arrangement including a chlorinated benzene ring connected to a thiazole and imidazoline group, along with the hydrochloride component.*
FDA Label Image

Image Description (Zan01 0001 02a)

Image Description (Zan01 0001 02a)
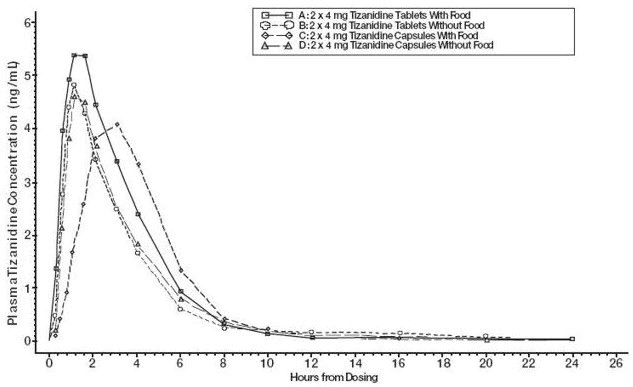
A pharmacokinetic graph showing plasma Tizanidine concentration (ng/mL) over time (hours) post-dosing. The chart compares four conditions: 2x 4 mg Tizanidine tablets with food, 2x 4 mg tablets without food, 2x 4 mg capsules with food, and 2x 4 mg capsules without food, illustrating concentration changes up to 24 hours after dosing.*
FDA Label Image

Image Description (Zan01 0001 03a)

Image Description (Zan01 0001 03a)
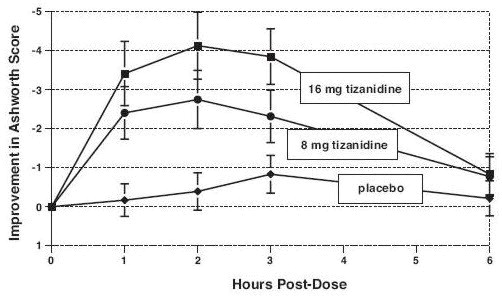
Line graph showing improvement in Ashworth Score over hours post-dose for 8 mg tizanidine, 16 mg tizanidine, and placebo. The graph illustrates a peak improvement between 2 and 3 hours after dosing for both tizanidine doses, with higher scores for 16 mg dose, compared to near-zero improvement for placebo.*
FDA Label Image

Image Description (Zan01 0001 04a)

Image Description (Zan01 0001 04a)
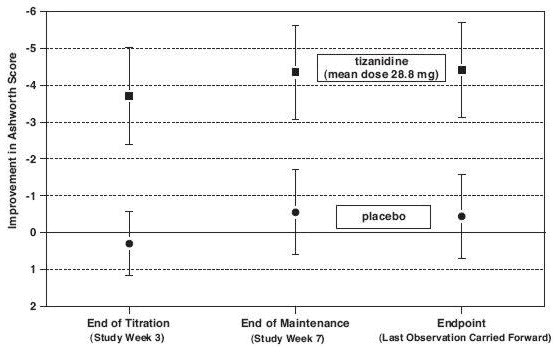
A line graph showing improvement in Ashworth Score over time at three study points: End of Titration (Week 3), End of Maintenance (Week 7), and Endpoint (Last Observation). Two groups are compared: tizanidine (mean dose 28.8 mg) showing consistent improvement, and placebo showing minimal change, with error bars indicating variability.*

* About these descriptions: Image descriptions on this page are generated by automated AI analysis of the product label images from the manufacturer's FDA label submission (SPL). They are provided for reference only and may contain errors or omissions. Always rely on the printed label itself and the official FDA labeling, and consult a pharmacist or healthcare professional with any questions about this product.