Camzyos Capsule, Gelatin Coated
Product Images NDC 73625-114

15 FDA label images from Myokardia, Inc. · Packaging, Regulatory Labels, and Product Appearance

Product Visual Gallery

This gallery contains 15 technical images submitted to the FDA as part of the official labeling for Camzyos (NDC 73625-114). Unlike standard consumer photos, these assets often include clinical data figures, molecular chemical structures, and official manufacturer packaging layouts.

As provided by Myokardia, Inc., these visuals offer a comprehensive scientific overview of the product's physical and chemical identity, aiding pharmacists and researchers in product verification and study.

FDA Label Image

15mglabel (15mglabel)
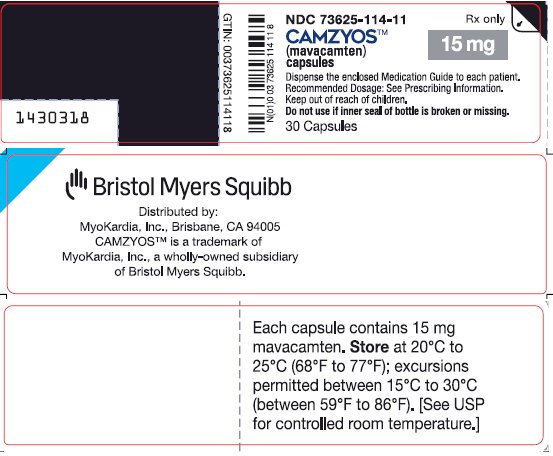
15mglabel (15mglabel)
CAMZYOS 15 mg capsules gelatin coated, oral human prescription drug. The label states the active ingredient as mavacamten. It includes directions to dispense a Medication Guide to patients and notes prescription only use. The package contains 30 capsules and warns against using if the bottle seal is broken or missing. Distributed by MyoKardia, Inc., a subsidiary of Bristol Myers Squibb, with storage instructions for controlled room temperature.*
FDA Label Image

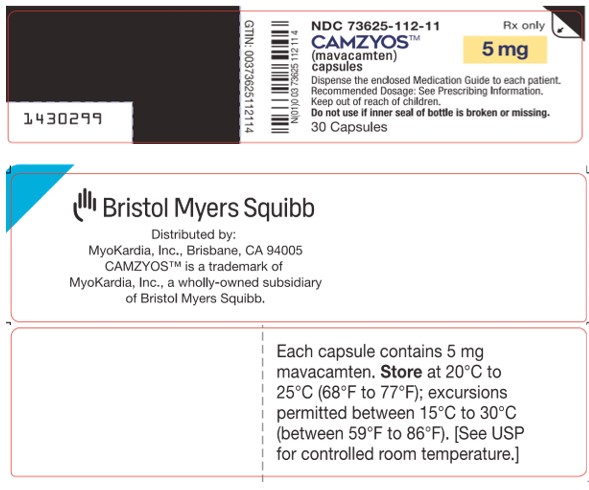
5mglabel (5mglabel)

5mglabel (5mglabel)
Label for CAMZYOS 5 mg gelatin-coated capsules containing mavacamten, distributed by Myokardia, Inc., a subsidiary of Bristol Myers Squibb. The label indicates 30 capsules per bottle, with storage instructions at controlled room temperature and a caution about the inner seal. The NDC number 73625-112-11 is shown.*
FDA Label Image

Chemical_structure (Chemical Structure)

Chemical_structure (Chemical Structure)
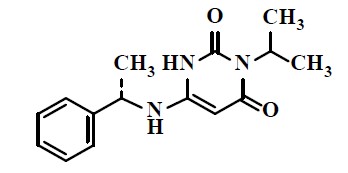
Chemical structure of the active ingredient mavacamten, showing its molecular formula with labeled atoms and bonds.*
FDA Label Image

Fig_cumulativedistributionofchangefrombaselinetoweek30inlvotpeakgradient (Fig Cumulativedistributionofchangefrombaselinetoweek30inlvotpeakgradient)

Fig_cumulativedistributionofchangefrombaselinetoweek30inlvotpeakgradient (Fig Cumulativedistributionofchangefrombaselinetoweek30inlvotpeakgradient)
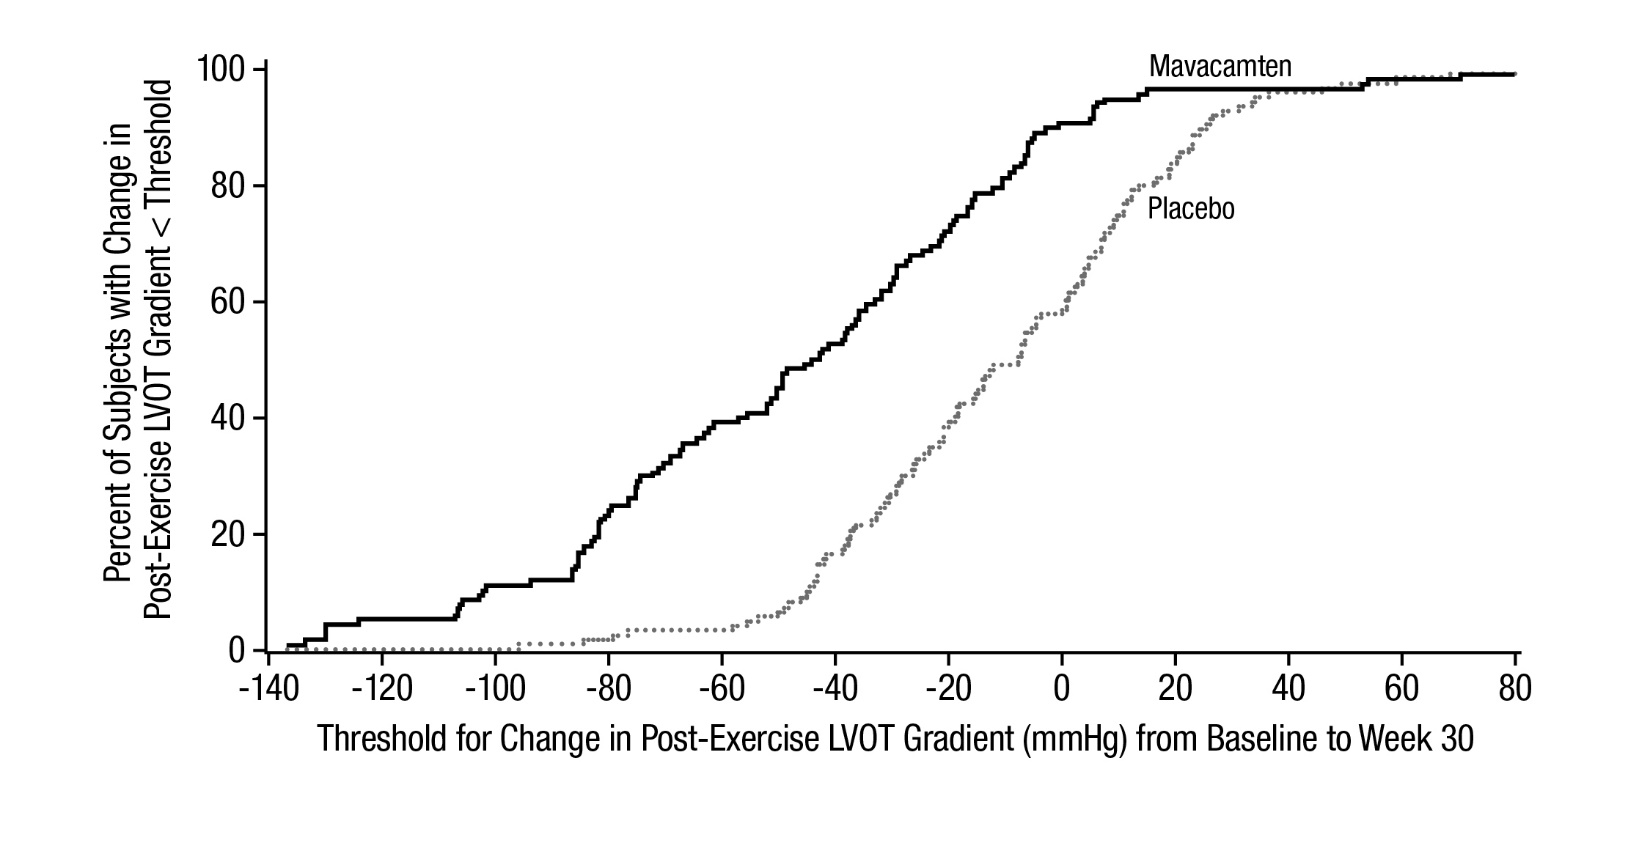
A cumulative distribution curve comparing the percent of subjects with change in post-exercise LVOT (left ventricular outflow tract) gradient below a threshold from baseline to week 30 for mavacamten versus placebo. The x-axis shows the threshold for change in LVOT gradient in mmHg, and the y-axis shows the percent of subjects meeting that threshold.*
FDA Label Image

Fig_cumulativedistributionofchangefrombaselinetoweek30inpvo2 (Fig Cumulativedistributionofchangefrombaselinetoweek30inpvo2)

Fig_cumulativedistributionofchangefrombaselinetoweek30inpvo2 (Fig Cumulativedistributionofchangefrombaselinetoweek30inpvo2)
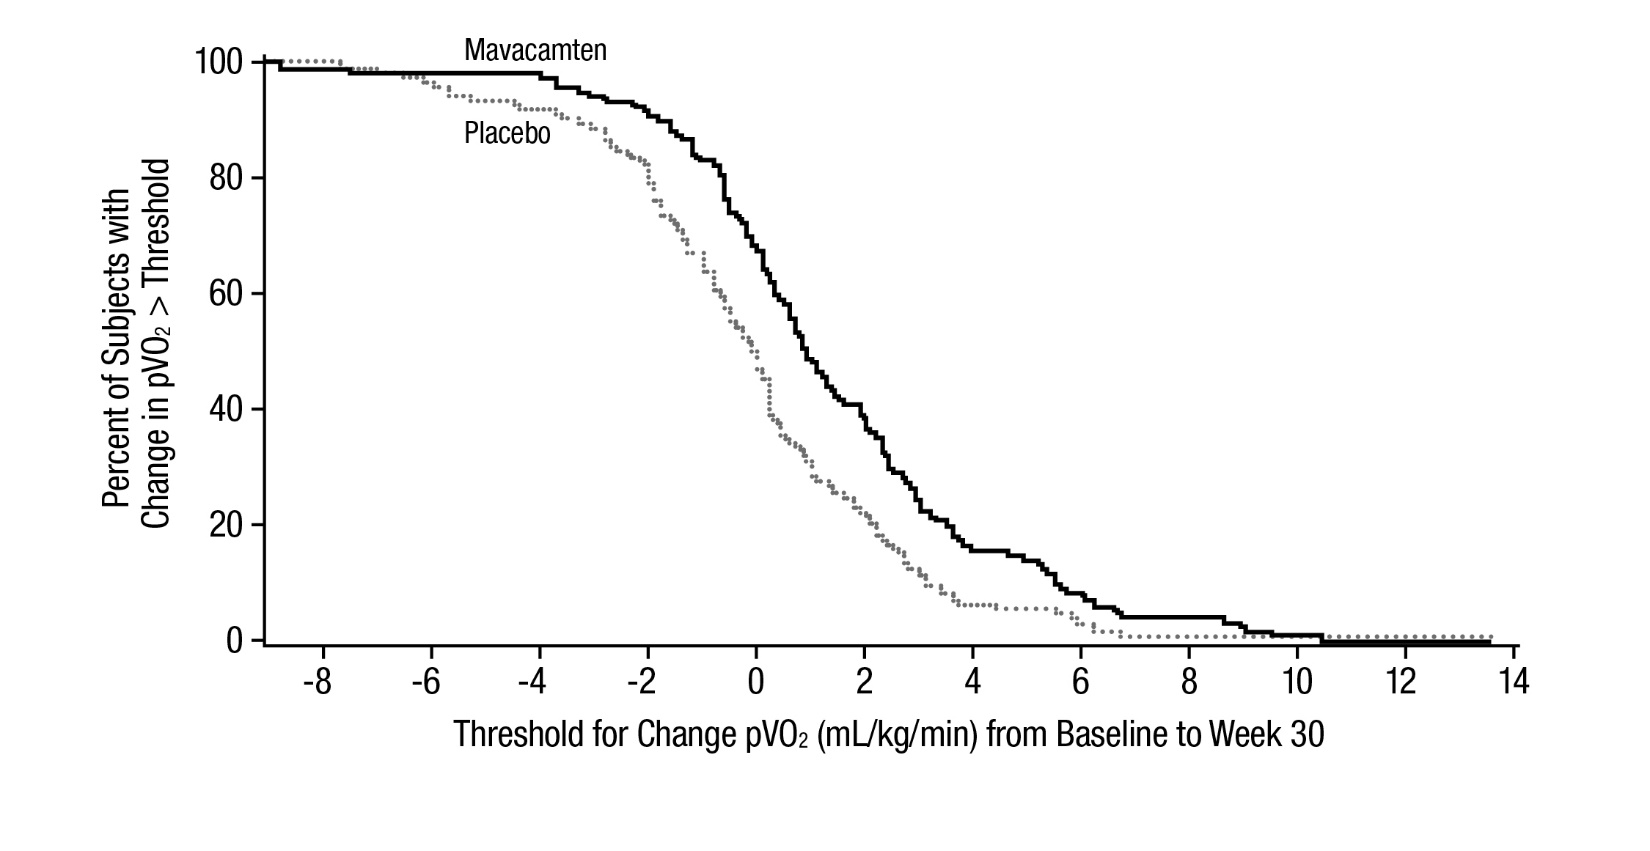
A Kaplan-Meier plot comparing the percent of subjects with a change in pVO2 above various thresholds from baseline to week 30 for mavacamten and placebo groups. The X-axis shows the threshold for change in pVO2 (mL/kg/min), and the Y-axis shows the percent of subjects above the threshold, with separate curves for mavacamten and placebo.*
FDA Label Image

Fig_hcmsqshortnessofbreathdomaincummlativedistributionofchangefrombaselinetoweek30 (Fig Hcmsqshortnessofbreathdomaincummlativedistributionofchangefrombaselinetoweek30)

Fig_hcmsqshortnessofbreathdomaincummlativedistributionofchangefrombaselinetoweek30 (Fig Hcmsqshortnessofbreathdomaincummlativedistributionofchangefrombaselinetoweek30)
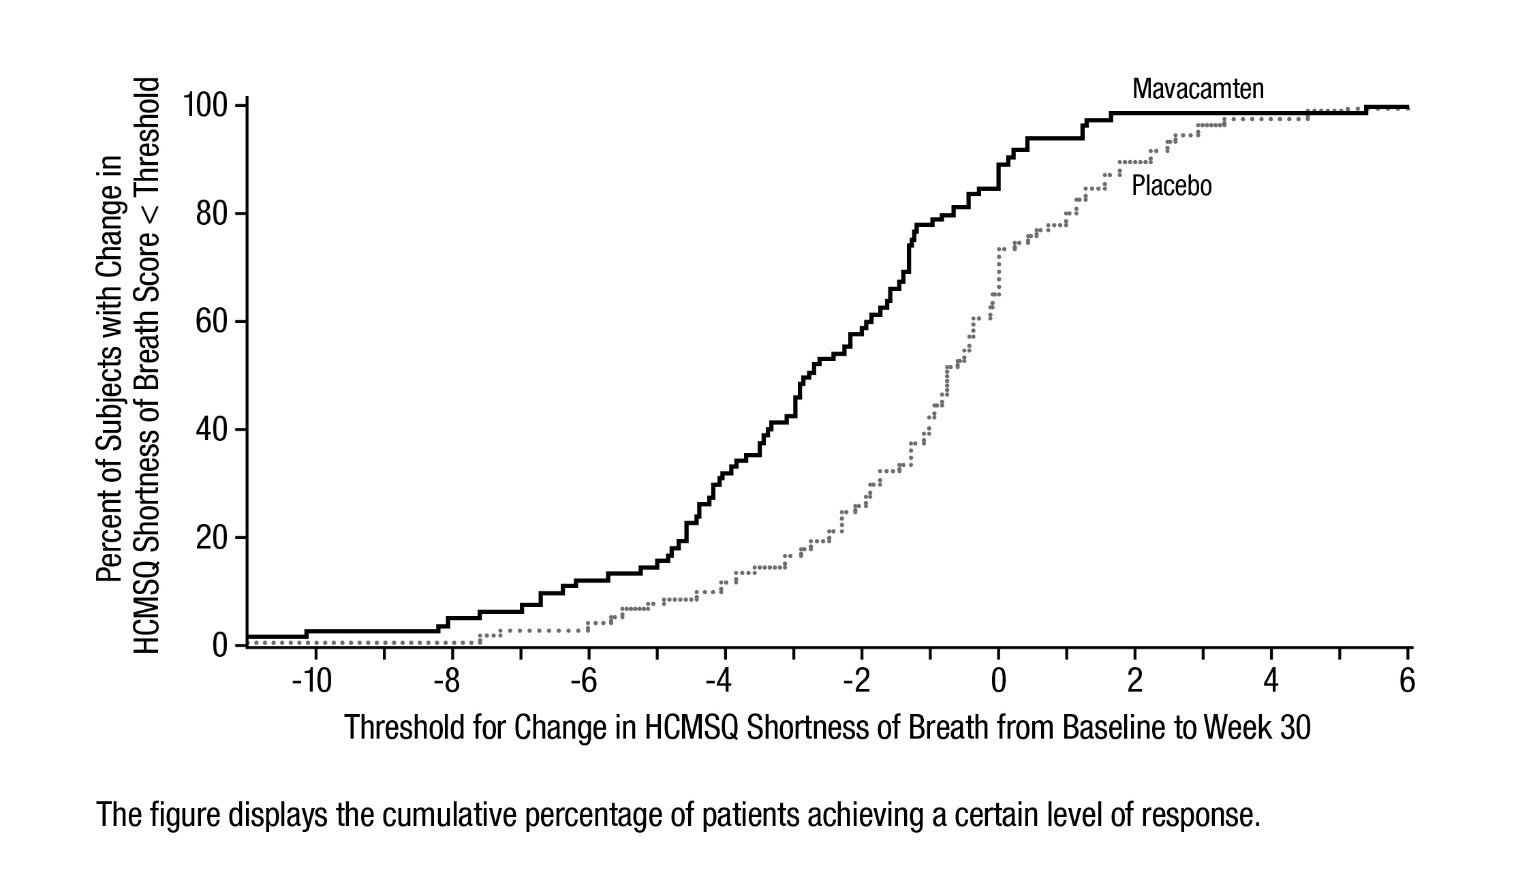
A cumulative percentage graph showing the percent of subjects with change in HCMSQ Shortness of Breath score less than threshold on the y-axis and threshold for change in HCMSQ Shortness of Breath from baseline to week 30 on the x-axis. Two curves compare Mavacamten and Placebo, illustrating patient response levels over the threshold range.*
FDA Label Image

Fig_hcmsqshortnessofbreathdomainmeanchangefrombaselineovertime (Fig Hcmsqshortnessofbreathdomainmeanchangefrombaselineovertime)

Fig_hcmsqshortnessofbreathdomainmeanchangefrombaselineovertime (Fig Hcmsqshortnessofbreathdomainmeanchangefrombaselineovertime)
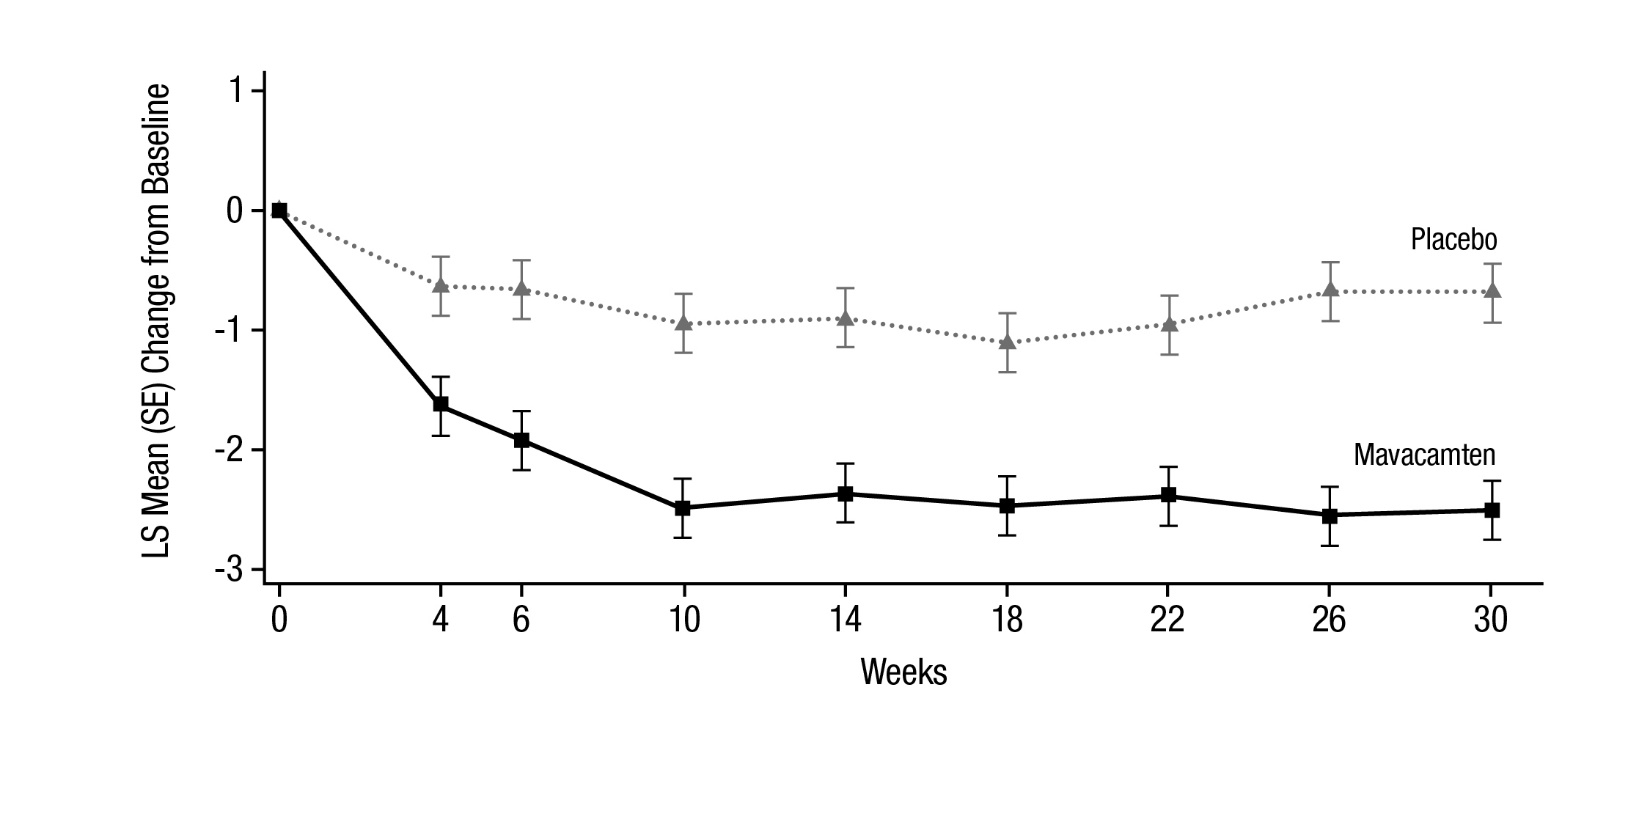
A line graph comparing LS mean (SE) change from baseline over 30 weeks between mavacamten and placebo groups. The x-axis represents weeks, and the y-axis shows LS mean change. The mavacamten group shows a greater decrease from baseline compared to placebo, with data points and error bars for standard error.*
FDA Label Image

Fig_initiationphase (Fig Initiationphase)

Fig_initiationphase (Fig Initiationphase)
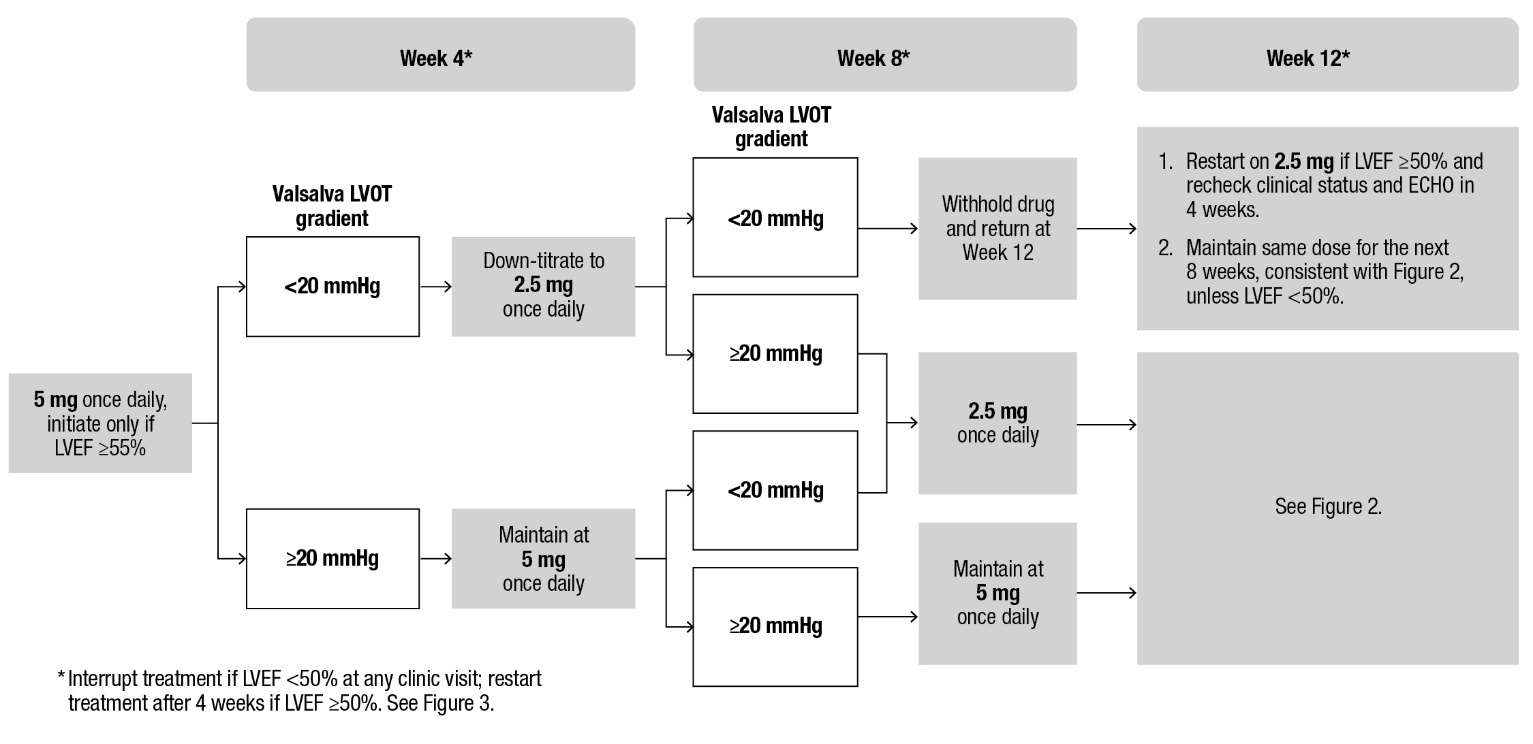
An illustrated flowchart showing dosing adjustments for CAMZYOS (mavacamten) capsules at weeks 4, 8, and 12 based on Valsalva LVOT gradient and LVEF values. It details criteria for initiating, maintaining, titrating down to 2.5 mg, or withholding the drug, with respective instructions for clinical monitoring and dose changes over a 12-week period.*
FDA Label Image

Fig_kccq-23clinicalsummaryscorecumalativedistributionofchangefrombaselinetoweek30 (Fig Kccq 23clinicalsummaryscorecumalativedistributionofchangefrombaselinetoweek30)

Fig_kccq-23clinicalsummaryscorecumalativedistributionofchangefrombaselinetoweek30 (Fig Kccq 23clinicalsummaryscorecumalativedistributionofchangefrombaselinetoweek30)
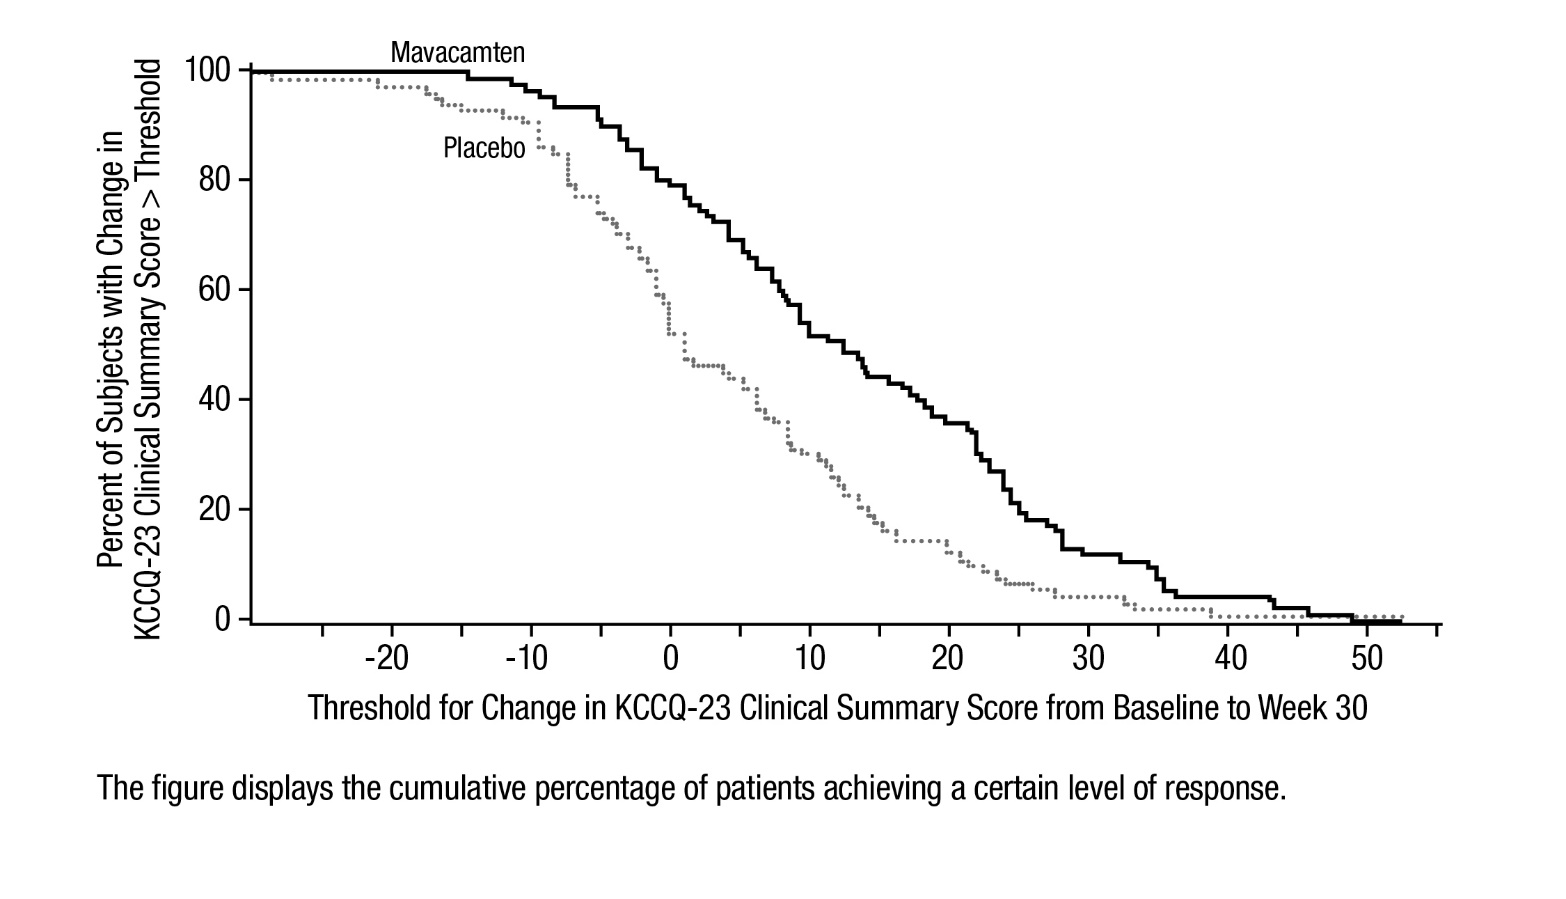
A cumulative percentage line graph comparing patients treated with mavacamten versus placebo, showing the percent of subjects with change in KCCQ-23 clinical summary score above threshold from baseline to week 30. The graph depicts higher cumulative response rates for mavacamten over placebo across various change thresholds.*
FDA Label Image

Fig_kccq-23clinicalsummaryscoremeanchangefrombaselineovertime (Fig Kccq 23clinicalsummaryscoremeanchangefrombaselineovertime)

Fig_kccq-23clinicalsummaryscoremeanchangefrombaselineovertime (Fig Kccq 23clinicalsummaryscoremeanchangefrombaselineovertime)
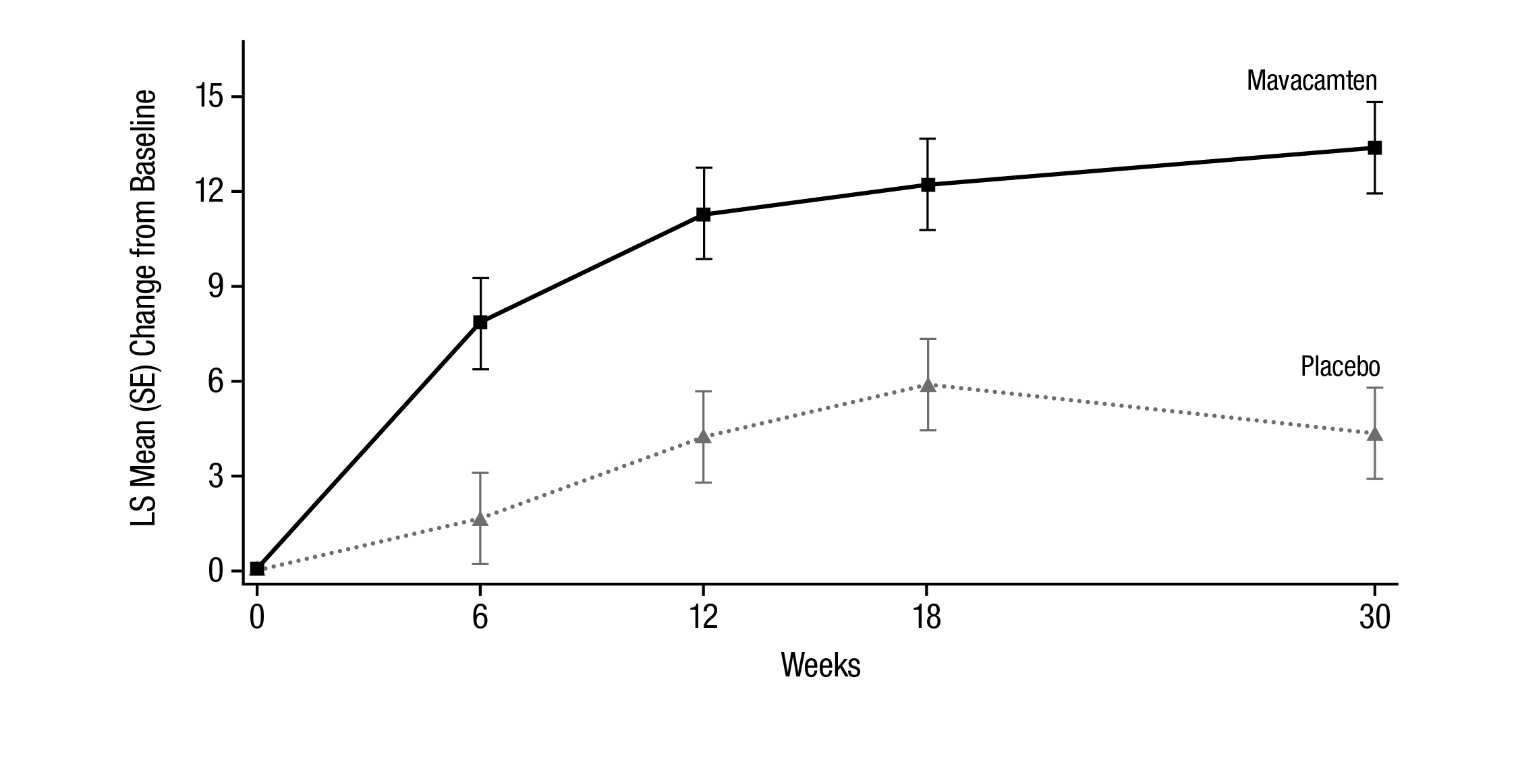
Line graph depicting LS Mean (SE) change from baseline over 30 weeks comparing mavacamten and placebo groups. The vertical axis shows change from baseline, ranging from 0 to 15, while the horizontal axis shows time in weeks from 0 to 30. Mavacamten shows a marked increase over time with error bars, whereas placebo shows a more modest, fluctuating increase.*
FDA Label Image

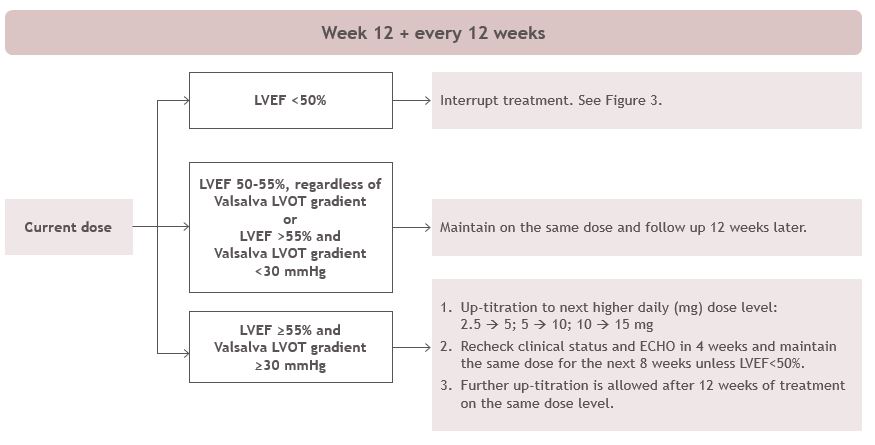
Fig_maintenancephase (Fig Maintenancephase)

Fig_maintenancephase (Fig Maintenancephase)
A dosage adjustment flowchart for CAMZYOS (mavacamten) capsules at week 12 and every 12 weeks thereafter. It guides dose changes based on left ventricular ejection fraction (LVEF) and Valsalva left ventricular outflow tract (LVOT) gradient measurements, including criteria to interrupt treatment, maintain the current dose, or increase dosage stepwise from 2.5 mg up to 15 mg with clinical status reassessments.*
FDA Label Image

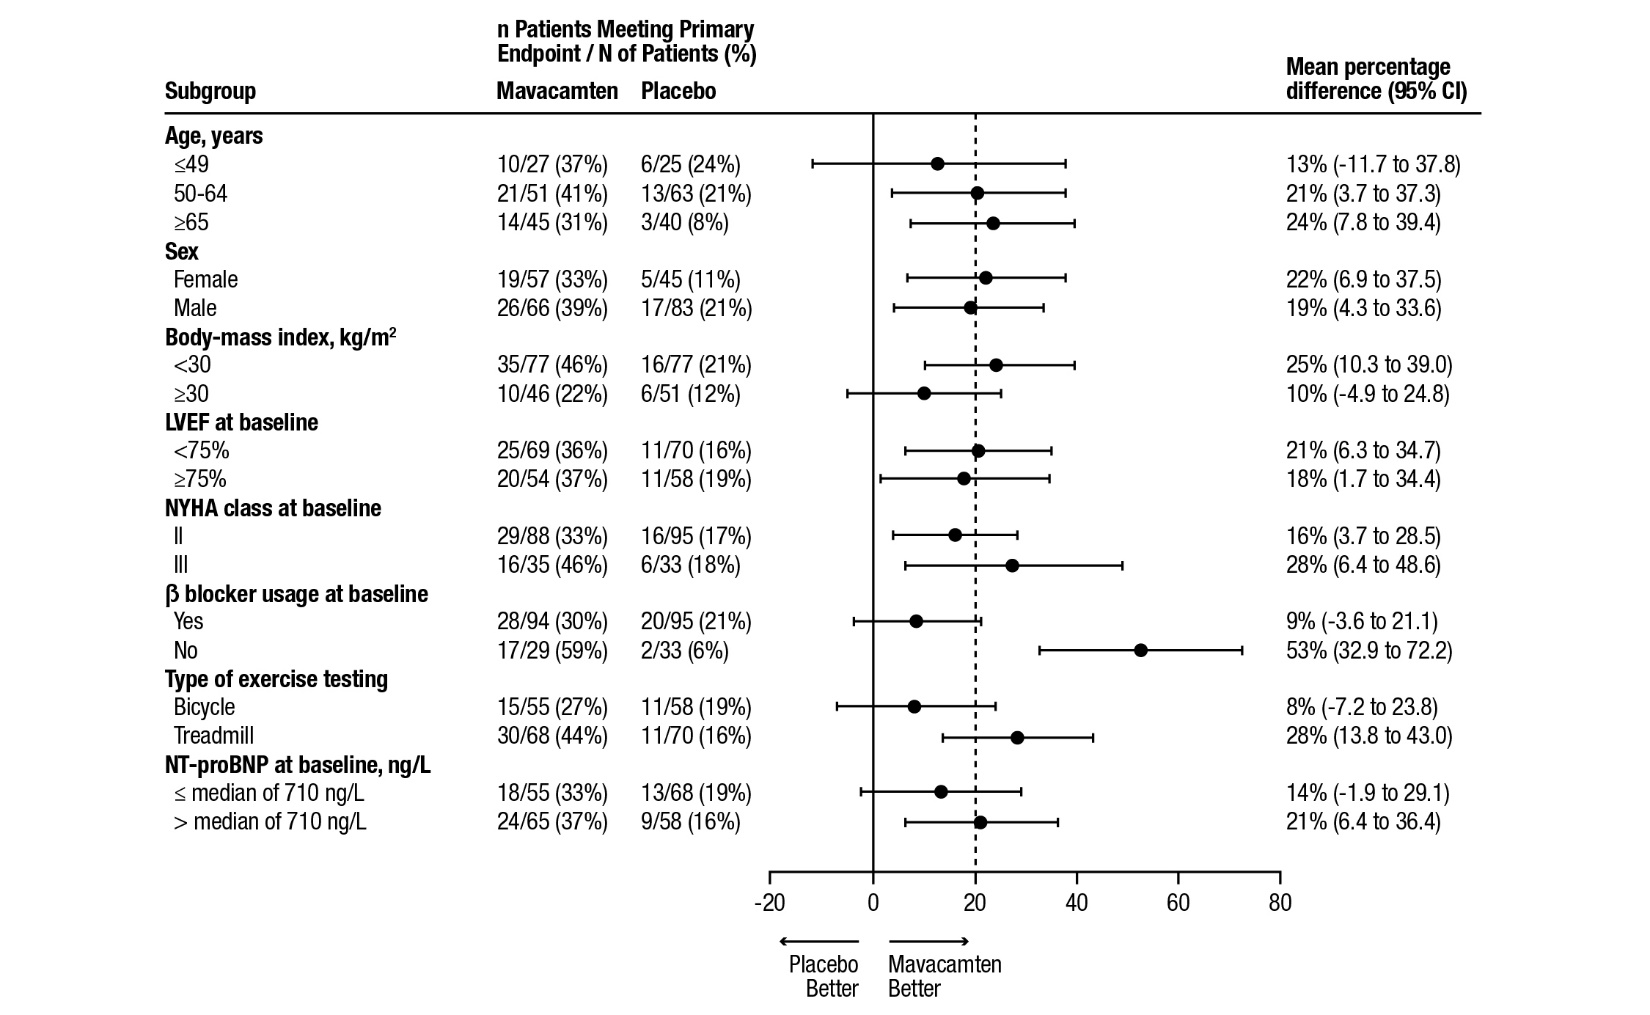
Fig_subgroupanalysisoftheprimarycompositefunctionalendpoint (Fig Subgroupanalysisoftheprimarycompositefunctionalendpoint)

Fig_subgroupanalysisoftheprimarycompositefunctionalendpoint (Fig Subgroupanalysisoftheprimarycompositefunctionalendpoint)
Forest plot chart showing subgroup analysis of patients meeting primary endpoints comparing mavacamten and placebo. Subgroups include age, sex, body-mass index, LVEF at baseline, NYHA class, beta blocker usage, type of exercise testing, and NT-proBNP levels, displaying event counts, percentages, and mean percentage differences with 95% confidence intervals.*
FDA Label Image

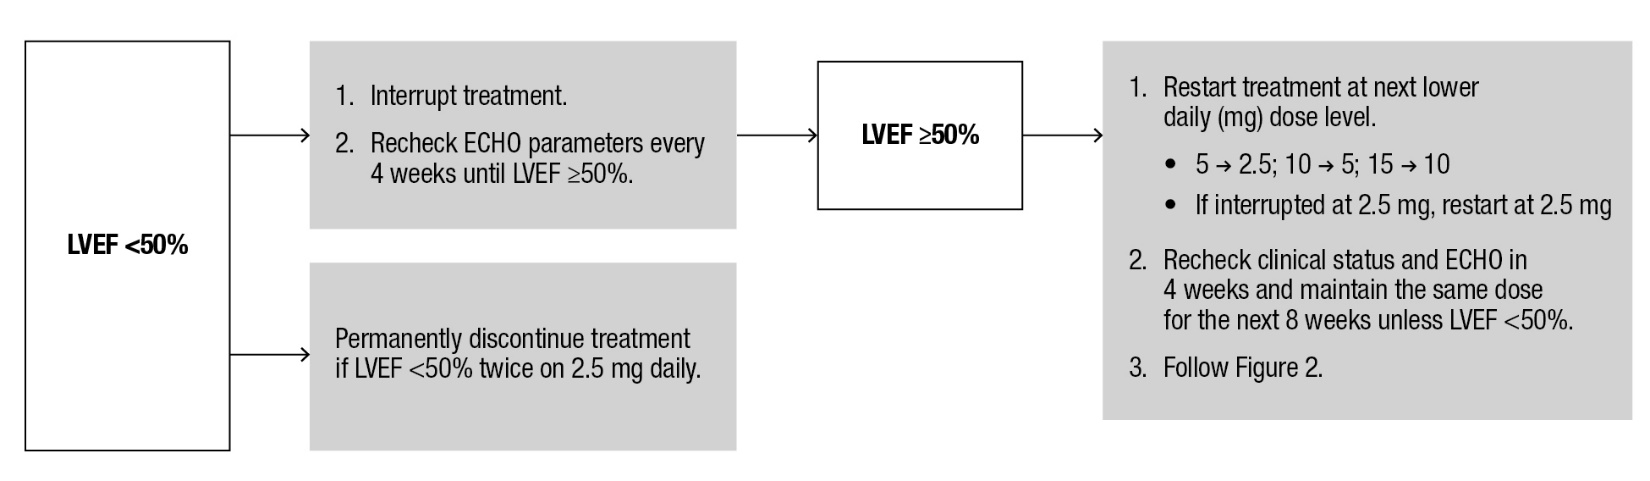
Fig_treatmentinterruption (Fig Treatmentinterruption)

Fig_treatmentinterruption (Fig Treatmentinterruption)
A flowchart illustrating treatment management based on LVEF (left ventricular ejection fraction) values. It shows steps to interrupt treatment and recheck ECHO parameters if LVEF is below 50%, conditions for permanent treatment discontinuation, and dosage adjustment procedures when LVEF is 50% or higher, including specific dose level reductions and timelines for rechecking clinical status and ECHO.*
FDA Label Image

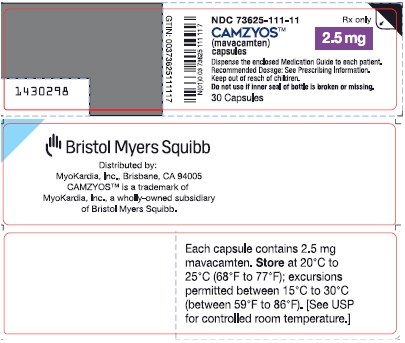
2_5mglabel (Image 01)

2_5mglabel (Image 01)
CAMZYOS 2.5 mg gelatin coated capsules label by Myokardia, Inc., distributed by Bristol Myers Squibb. The label includes the NDC number 73625-111-11 and dosing instructions emphasizing proper storage at controlled room temperature. The package contains 30 capsules and is for prescription use only.*
FDA Label Image

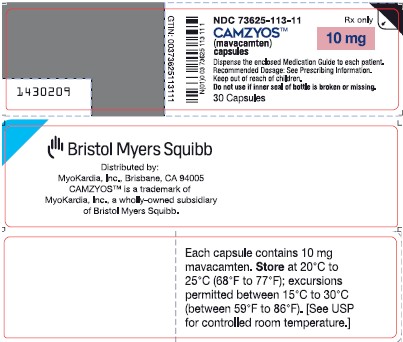
10mglabel (Image 02)

10mglabel (Image 02)
CAMZYOS 10 mg gelatin coated capsules label shows the drug name and strength prominently on the front. It is prescribed oral medication containing mavacamten, with a package size of 30 capsules. The label states storage conditions and confirms distribution by Bristol Myers Squibb and MyoKardia, Inc., a subsidiary of Bristol Myers Squibb.*

* About these descriptions: Image descriptions on this page are generated by automated AI analysis of the product label images from the manufacturer's FDA label submission (SPL). They are provided for reference only and may contain errors or omissions. Always rely on the printed label itself and the official FDA labeling, and consult a pharmacist or healthcare professional with any questions about this product.