Product Images Tamsulosin Hydrochloride

View Photos of Packaging, Labels & Appearance

Product Label Images

The following 7 images provide visual information about the product associated with Tamsulosin Hydrochloride NDC 73750-099 by Qyk Brands Llc, such as packaging, labeling, and the appearance of the drug itself. This resource could be helpful for medical professionals, pharmacists, and patients seeking to verify medication information and ensure they have the correct product.

73750 099 copy

73750 099 copy

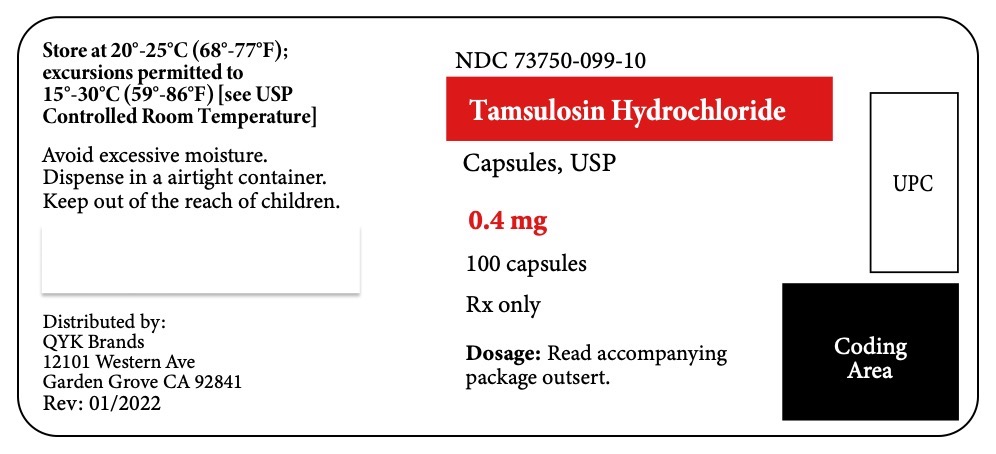
This is a prescription medication called Tamsulosin Hydrochloride Capsules, USP with a dosage of 0.4mg per capsule. It comes in a container with 100 capsules and should be stored at a temperature range of 20°C-25°C (68°F-77°F), with excursions permitted to 15°C-30°C (59°F-86°F). Excessive moisture should be avoided, and it should be dispensed in an airtight container. It is distributed by QYK Brands in Garden Grove, CA, with a revision date of 01/2022. The package insert should be read before administering, and it is important to keep it out of the reach of children. The product has an NDC number of 73750-099-10.*

Figure 1 Mean Plasma Tamsulosin Hydrochloride Concentrations Following Single-Dose Administration of Tamsulosin Hydrochloride Capsules 0.4 mg Under Fasted and Fed Conditions (n = 8) - figure 1

Figure 1 Mean Plasma Tamsulosin Hydrochloride Concentrations Following Single-Dose Administration of Tamsulosin Hydrochloride Capsules 0.4 mg Under Fasted and Fed Conditions (n = 8) - figure 1

Figure 2A Mean Change from Baseline in Total AUA Symptom Score (0-35) Study 1 - figure 2 a

Figure 2A Mean Change from Baseline in Total AUA Symptom Score (0-35) Study 1 - figure 2 a

Figure 2B Mean Change from Baseline in Total AUA Symptom Score (0-35) Study 2 - figure 2 b

Figure 2B Mean Change from Baseline in Total AUA Symptom Score (0-35) Study 2 - figure 2 b

Figure 3A Mean Increase in Peak Urine Flow Rate (mL/Sec) Study 1 - figure 3 a

Figure 3A Mean Increase in Peak Urine Flow Rate (mL/Sec) Study 1 - figure 3 a

Figure 3B Mean Increase in Peak Urine Flow Rate (mL/Sec) Study 2 - figure 3 b

Figure 3B Mean Increase in Peak Urine Flow Rate (mL/Sec) Study 2 - figure 3 b

Structure - structure

Structure - structure

* The product label images have been analyzed using a combination of traditional computing and machine learning techniques. It should be noted that the descriptions provided may not be entirely accurate as they are experimental in nature. Use the information in this page at your own discretion and risk.