Dofetilide Capsule
Product Images NDC 75907-056

View Photos of Packaging, Regulatory Labels, and Product Appearance

Product Visual Gallery

This gallery contains 9 technical images submitted to the FDA as part of the official labeling for Dofetilide (NDC 75907-056). Unlike standard consumer photos, these assets often include clinical data figures, molecular chemical structures, and official manufacturer packaging layouts.

As provided by Dr. Reddy's Labratories Inc., these visuals offer a comprehensive scientific overview of the product's physical and chemical identity, aiding pharmacists and researchers in product verification and study.

FDA Label Image

Pdp-0.125 mg 60ct (Dofetilide 07)
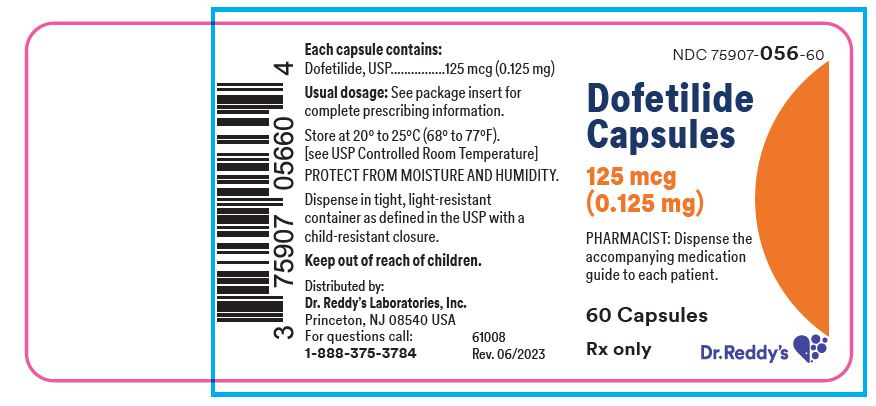
Pdp-0.125 mg 60ct (Dofetilide 07)
Label for Dofetilide Capsules 125 mcg (0.125 mg) oral capsules by Dr. Reddy's Laboratories Inc. The label includes dosing instructions, storage conditions (20° to 25°C), and safety warnings, stating 60 capsules per container. It also mentions prescription-only status and provides a pharmacist instruction and company contact information.*
FDA Label Image

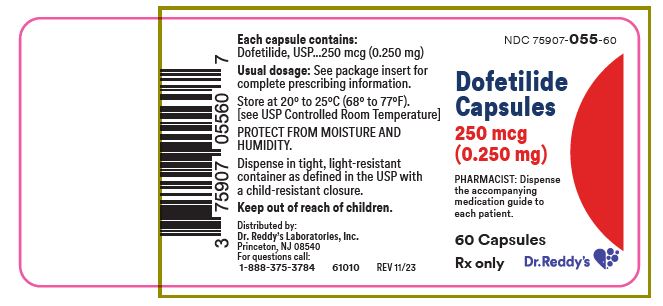
Pdp-0.25 mg 60ct (Dofetilide 08)

Pdp-0.25 mg 60ct (Dofetilide 08)
Dofetilide Capsules 250 mcg (0.250 mg) oral dose label from Dr. Reddy's Laboratories Inc. The label includes storage instructions, dispensing guidance, and a barcode. The package contains 60 capsules, Rx only, with emphasis on protecting from moisture and humidity.*
FDA Label Image

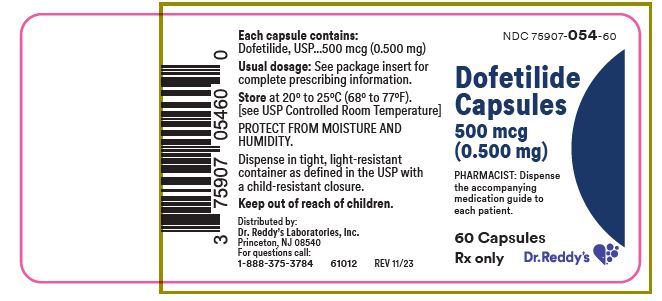
Pdp-0.5 mg 60ct (Dofetilide 09)

Pdp-0.5 mg 60ct (Dofetilide 09)
Dofetilide Capsules 500 mcg (0.500 mg) oral medication label by Dr. Reddy's Laboratories Inc. The label states each capsule contains 500 mcg of dofetilide and includes storage instructions (20° to 25°C), moisture protection advice, and dispensing instructions. The package contains 60 capsules and is marked Rx only.*
FDA Label Image

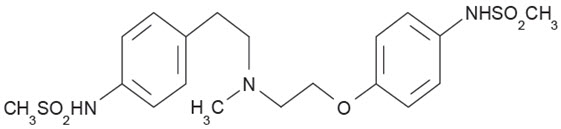
Chemical Structure (Dofetilide 01)

Chemical Structure (Dofetilide 01)
Chemical structure of Dofetilide, showing its molecular arrangement with aromatic rings, sulfonamide groups, and ether linkages.*
FDA Label Image

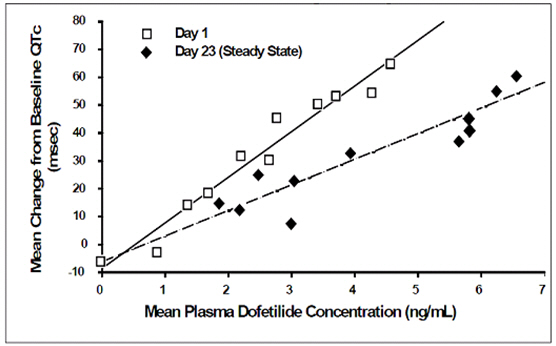
Figure 1 (Dofetilide 02)

Figure 1 (Dofetilide 02)
Line chart depicting the mean change from baseline QTc interval (in milliseconds) versus mean plasma dofetilide concentration (ng/mL) on Day 1 and Day 23 (Steady State). Two data series are shown: open squares for Day 1 and filled diamonds for Day 23, illustrating the relationship between plasma concentration and QTc change over time.*
FDA Label Image

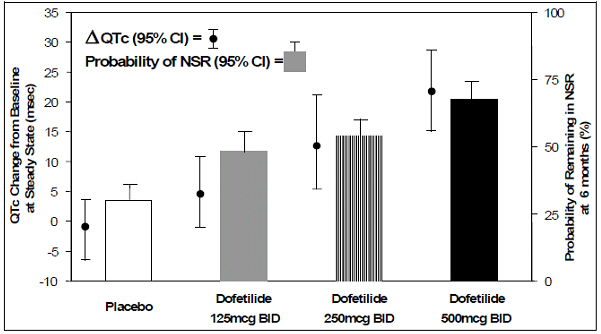
Figure 2 (Dofetilide 03)

Figure 2 (Dofetilide 03)
A bar and scatter plot chart depicting QTc change from baseline at steady state (msec) on the left y-axis, and probability of remaining in NSR at 6 months (%) on the right y-axis. The x-axis compares placebo with three Dofetilide dosing groups: 125 mcg BID, 250 mcg BID, and 500 mcg BID. The chart includes 95% confidence intervals for both measures.*
FDA Label Image

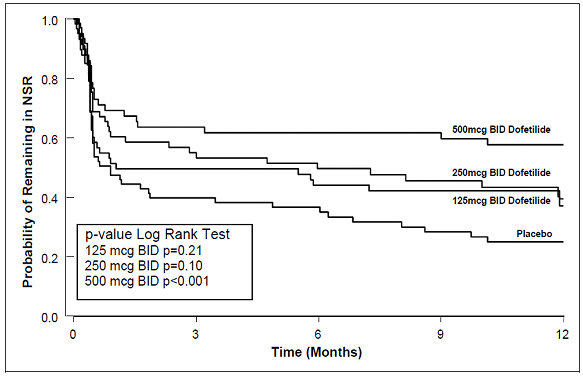
Figure 3 (Dofetilide 04)

Figure 3 (Dofetilide 04)
A Kaplan-Meier survival curve chart showing the probability of remaining in NSR (normal sinus rhythm) over 12 months for patients treated with Dofetilide at doses of 125 mcg, 250 mcg, and 500 mcg twice daily (BID), compared with placebo. The y-axis represents the probability of remaining in NSR, and the x-axis shows time in months. The 500 mcg BID Dofetilide group shows the highest probability over time.*
FDA Label Image

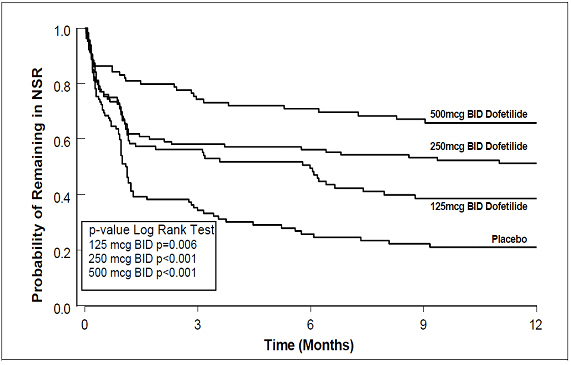
Figure 4 (Dofetilide 05)

Figure 4 (Dofetilide 05)
A line graph displaying the probability of remaining in normal sinus rhythm (NSR) over a 12-month period for four groups: 500 mcg BID dofetilide, 250 mcg BID dofetilide, 125 mcg BID dofetilide, and placebo. The y-axis represents the probability of remaining in NSR, and the x-axis represents time in months. The graph includes p-values from a Log Rank Test comparing the groups.*
FDA Label Image

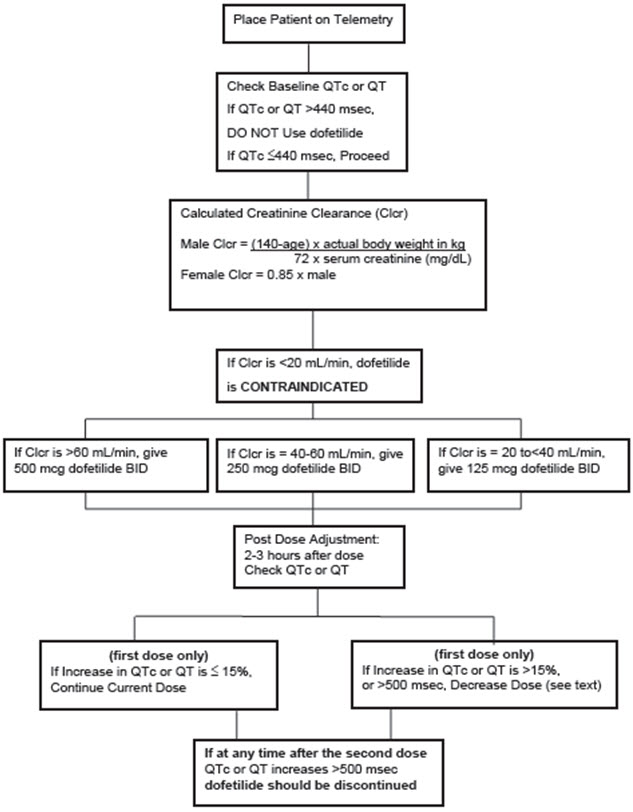
Figure (Dofetilide 06)

Figure (Dofetilide 06)
A flowchart illustrating dosage adjustment guidelines for dofetilide capsules based on patient telemetry monitoring and creatinine clearance (Clcr) levels. The chart details steps for baseline QTc or QT interval checks, creatinine clearance calculations by gender, dosage recommendations for varying Clcr ranges, and post-dose monitoring with instructions for dose continuation, reduction, or discontinuation.*

* About these descriptions: Image descriptions on this page are generated by automated AI analysis of the product label images from the manufacturer's FDA label submission (SPL). They are provided for reference only and may contain errors or omissions. Always rely on the printed label itself and the official FDA labeling, and consult a pharmacist or healthcare professional with any questions about this product.