Ravicti Liquid
Product Images NDC 75987-050

7 FDA label images from Horizon Therapeutics Usa, Inc. · Packaging, Regulatory Labels, and Product Appearance

Product Visual Gallery

This gallery contains 7 technical images submitted to the FDA as part of the official labeling for Ravicti (NDC 75987-050). Unlike standard consumer photos, these assets often include clinical data figures, molecular chemical structures, and official manufacturer packaging layouts.

As provided by Horizon Therapeutics Usa, Inc., these visuals offer a comprehensive scientific overview of the product's physical and chemical identity, aiding pharmacists and researchers in product verification and study.

FDA Label Image

Chemical Structure (Ravicti 01)

Chemical Structure (Ravicti 01)
Chemical structure diagram of glycerol phenylbutyrate, the active ingredient in Ravicti oral liquid. The diagram shows the molecular structure with aromatic rings and ester linkages.*
FDA Label Image

Figure 1 (Ravicti 02)

Figure 1 (Ravicti 02)
A biochemical pathway diagram illustrating the metabolism related to glycerol phenylbutyrate (Ravicti). It shows conversion steps from α-Ketoglutarate and ammonia to glutamate and glutamine, alongside glycerol phenylbutyrate being hydrolyzed to phenylbutyric acid, then metabolized to phenylacetate, which combines to form phenylacetylglutamine for urine excretion.*
FDA Label Image

Figure 2 (Ravicti 03)

Figure 2 (Ravicti 03)
A line graph comparing mean normalized blood ammonia levels over 24 hours for Ravicti (glycerol phenylbutyrate) versus sodium phenylbutyrate. The x-axis represents time points from 0 to 24 hours, including fasting and various hourly intervals. The y-axis shows mean blood ammonia concentration in micromol per liter, with error bars indicating standard error. Ravicti is shown as a solid line with square markers, and sodium phenylbutyrate as a dashed line with triangle markers.*
FDA Label Image

Figure 3 (Ravicti 04)

Figure 3 (Ravicti 04)
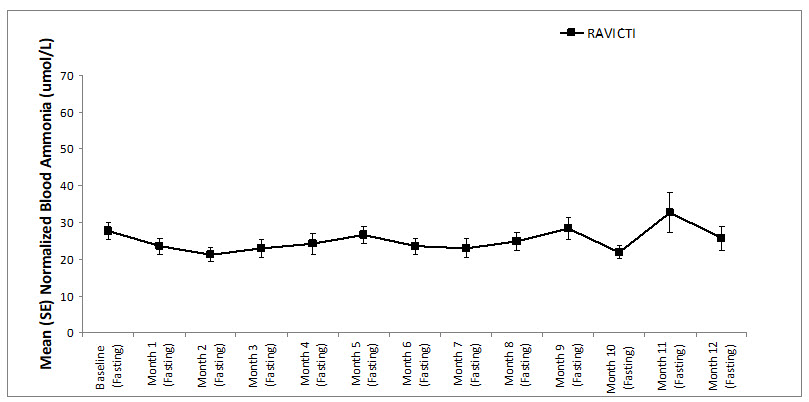
Line graph showing mean normalized blood ammonia levels (μmol/L) with standard error bars in patients treated with Ravicti over a 12-month period. The x-axis represents time points from baseline through Month 12 fasting, and the y-axis shows blood ammonia concentration. The graph tracks ammonia levels longitudinally with fluctuations around 20 to 30 μmol/L.*
FDA Label Image

Figure 4 (Ravicti 05)

Figure 4 (Ravicti 05)
A line graph comparing mean (SE) normalized blood ammonia levels (μmol/L) over time between Ravicti and Sodium Phenylbutyrate. The x-axis shows time points at 0-hour fasting, 8-hour, 12-hour, and 24-hour fasting, while the y-axis indicates blood ammonia levels from 0 to 70 μmol/L. Ravicti and Sodium Phenylbutyrate have distinct data points connected by lines, showing trends in blood ammonia levels over these intervals.*
FDA Label Image

Figure 5 (Ravicti 06)

Figure 5 (Ravicti 06)
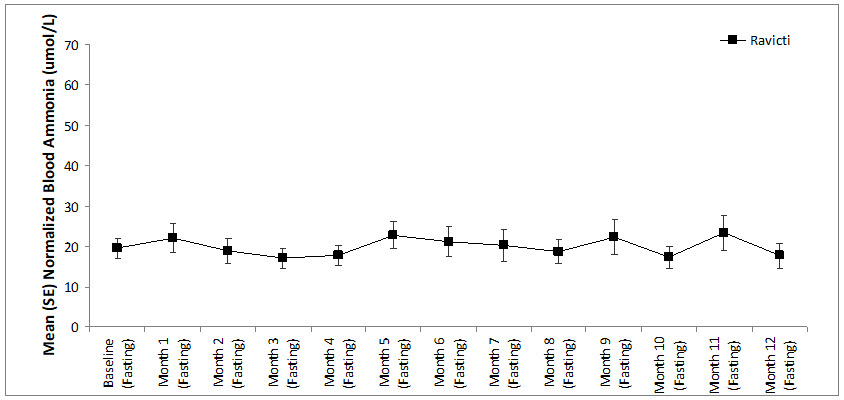
A line graph showing the mean normalized blood ammonia levels (µmol/L) with standard error bars over 12 months for Ravicti, measured at baseline and monthly fasting intervals. The graph plots a relatively stable trend of blood ammonia concentration during the treatment period.*
FDA Label Image

Principal Display Panel (25 mL Bottle Carton)

Principal Display Panel (25 mL Bottle Carton)
Ravicti (glycerol phenylbutyrate) Oral Liquid 1.1 g/mL carton label for 25 mL bottles. The label shows dosing strength, oral liquid form, and instructions for pharmacists to dispense the enclosed Medication Guide. Distributed by Horizon Therapeutics USA, Inc., with storage instructions and country of origin Austria. Includes barcodes and highlights the Rx Only status.*

* About these descriptions: Image descriptions on this page are generated by automated AI analysis of the product label images from the manufacturer's FDA label submission (SPL). They are provided for reference only and may contain errors or omissions. Always rely on the printed label itself and the official FDA labeling, and consult a pharmacist or healthcare professional with any questions about this product.