Budesonide Inhalation Suspension
Product Images NDC 76204-018

View Photos of Packaging, Regulatory Labels, and Product Appearance

Product Visual Gallery

This gallery contains 9 technical images submitted to the FDA as part of the official labeling for Budesonide Inhalation Suspension (NDC 76204-018). Unlike standard consumer photos, these assets often include clinical data figures, molecular chemical structures, and official manufacturer packaging layouts.

As provided by Ritedose Pharmaceuticals, Llc, these visuals offer a comprehensive scientific overview of the product's physical and chemical identity, aiding pharmacists and researchers in product verification and study.

FDA Label Image

Carton-front (Carton Front)
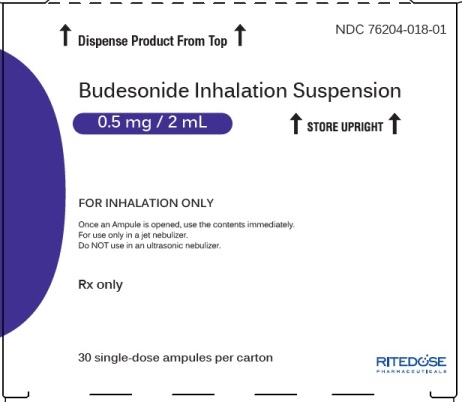
Carton-front (Carton Front)
Label for Budesonide Inhalation Suspension 0.5 mg / 2 mL by Ritedose Pharmaceuticals, LLC. The label specifies single-dose ampules, with 30 ampules per carton, for inhalation use only. It includes instructions to dispense the product from the top and to store it upright. The product is Rx only.*
FDA Label Image

Chemical-structure (Chemical Structure)

Chemical-structure (Chemical Structure)
Chemical structure of Budesonide, the active ingredient in Budesonide Inhalation Suspension by Ritedose Pharmaceuticals, LLC. The image depicts the molecular structure with detailed bond arrangements and functional groups.*
FDA Label Image

Figure-1 (Figure 1)

Figure-1 (Figure 1)
A line graph depicting mean change from baseline pre-bronchodilator FEV1 (L) over 12 weeks for Budesonide Inhalation Suspension at three dosages: 0.25 mg once daily, 0.5 mg once daily, and 1.0 mg once daily, compared to placebo. The x-axis represents study weeks, the y-axis shows change from baseline in FEV1, with error measurements shown by different data points and lines.*
FDA Label Image

Figure-2 (Figure 2)

Figure-2 (Figure 2)
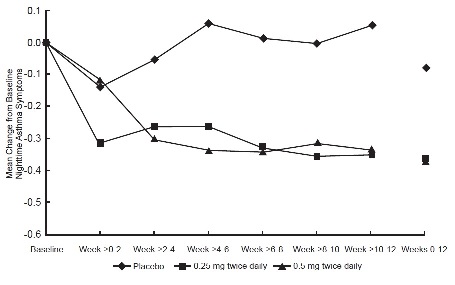
A line graph comparing mean change from baseline in nighttime asthma symptoms over 12 weeks for Budesonide Inhalation Suspension at doses 0.25 mg and 0.5 mg twice daily versus placebo. The x-axis shows weeks, and the y-axis shows mean change in symptoms, indicating symptom reduction trends with budesonide compared to placebo.*
FDA Label Image

Figure-3 (Figure 3)

Figure-3 (Figure 3)
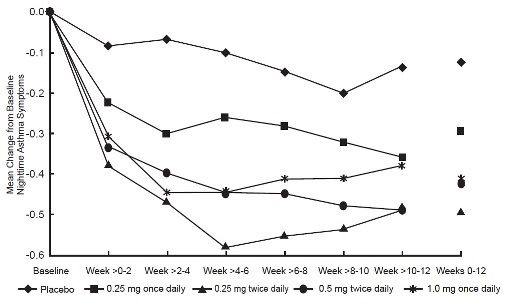
A line graph showing mean change from baseline nighttime asthma symptoms over a 12-week period. Multiple lines compare placebo and different dosages of Budesonide Inhalation Suspension, including 0.25 mg once daily, 0.25 mg twice daily, 0.5 mg twice daily, and 1.0 mg once daily, displaying symptom improvement trends over time.*
FDA Label Image

Pi-figure-1 (Pi Figure 1)

Pi-figure-1 (Pi Figure 1)
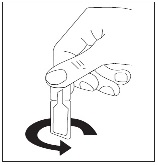
An instructional illustration showing a hand holding a single-dose vial or ampule of Budesonide Inhalation Suspension. An arrow indicates a twisting or turning motion at the base of the vial, suggesting how to open or activate the vial before use.*
FDA Label Image

Pi-figure-2 (Pi Figure 2)

Pi-figure-2 (Pi Figure 2)
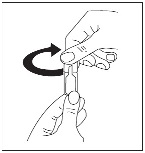
An instructional diagram showing a person twisting the top of a Budesonide Inhalation Suspension ampule to open it. The illustration focuses on hand positioning and directional movement for opening the medication container.*
FDA Label Image

Pi-figure-3 (Pi Figure 3)

Pi-figure-3 (Pi Figure 3)
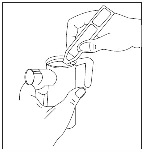
An instructional illustration showing a hand pouring Budesonide Inhalation Suspension from a vial into a nebulizer cup, demonstrating the preparation step before inhalation treatment.*
FDA Label Image

* About these descriptions: Image descriptions on this page are generated by automated AI analysis of the product label images from the manufacturer's FDA label submission (SPL). They are provided for reference only and may contain errors or omissions. Always rely on the printed label itself and the official FDA labeling, and consult a pharmacist or healthcare professional with any questions about this product.