Product Images Gabapentin

View Photos of Packaging, Labels & Appearance

Product Label Images

The following 7 images provide visual information about the product associated with Gabapentin NDC 76267-150 by Allied Pharma Inc, such as packaging, labeling, and the appearance of the drug itself. This resource could be helpful for medical professionals, pharmacists, and patients seeking to verify medication information and ensure they have the correct product.

600mg - 600mg

600mg - 600mg

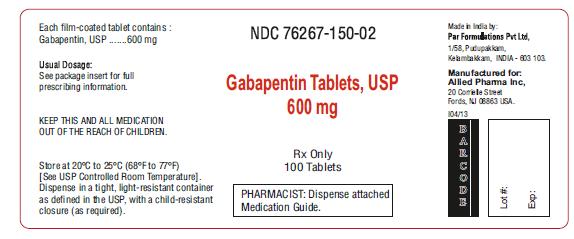
This is a medication label for Gabapentin Tablets, USP 600 mg. It contains instructions on dosage, storage, and safety precautions. Patients must keep medication away from children. The label also includes the National Drug Code (NDC) and information that pharmacists should dispense the medication with a Medication Guide. The label is manufactured for a company called Nse, but the text is too incomplete to provide further details.*

800mg - 800mg

800mg - 800mg

Each tablet contains 800mg of Gabapentin, USP. It is used for the passage and persisting information. It is recommended to keep out of reach of children and store it in a controlled room temperature of 20°C to 25°C. The medication guide should be consulted. The product is manufactured by Nse and comes in a pack of 100 tablets. The rest of the text is not readable.*

figure1.jpg - figure1

figure1.jpg - figure1

The text is a table or figure with percentages and labels indicating a study and treatments compared. A description of the content is not available due to the lack of information.*

figure2.jpg - figure2

figure2.jpg - figure2

This appears to be a graph or chart with a y-axis labeled "difference (%)" ranging from -10% to 30% and an x-axis labeled "daily dose (mg)" ranging from 600 mg to 1800 mg. There are two lines plotted on the graph labeled "STUDY a" and "@sTuDY b". The difference between the two lines ranges from around 2% at 600 mg to around 22% at 1800 mg. There are no further details available to determine what the study or medication being evaluated is.*

graph.jpg - graph

graph.jpg - graph

This is a chart displaying the mean pain score from a study. The dose of the medication being tested was 3600mg/day of gabapentin. The chart shows the pain scores at baseline, and at weeks 1, 2, 3, 4, 6, 7, and 8.*

graph1.jpg - graph1

graph1.jpg - graph1

The text describes a graph showing the mean pain score over the course of a 7-week period. The graph includes a 3-week dose titration period and a 4-week fixed dose period. There are three treatment groups represented: placebo, gabapentin 1800 mg/day, and gabapentin 2400 mg/day. The mean pain score decreased over time in all three groups, but was consistently lowest in the gabapentin 2400 mg/day group. The statistical significance of the results is indicated by a p-value of less than .001.*

structure.jpg - structure

structure.jpg - structure

* The product label images have been analyzed using a combination of traditional computing and machine learning techniques. It should be noted that the descriptions provided may not be entirely accurate as they are experimental in nature. Use the information in this page at your own discretion and risk.