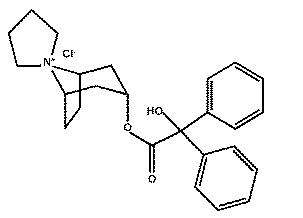
Product Images Trospium Chloride
View Photos of Packaging, Labels & Appearance
Product Label Images
The following 7 images provide visual information about the product associated with Trospium Chloride NDC 76282-336 by Exelan Pharmaceuticals Inc., such as packaging, labeling, and the appearance of the drug itself. This resource could be helpful for medical professionals, pharmacists, and patients seeking to verify medication information and ensure they have the correct product.
figure-1 - figure 1

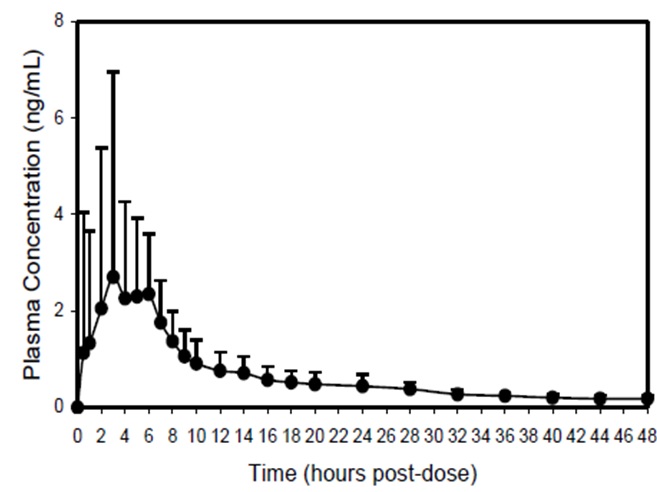
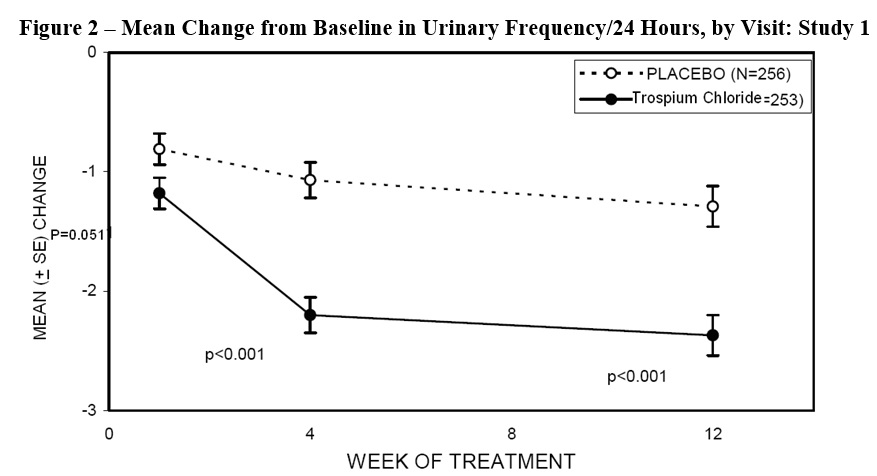
This is a graph that shows the plasma concentration (measured in ng/mL) of a substance over time (measured in hours post-dose). The x-axis shows the time post-dose ranging from 0 to 48 hours, and the y-axis shows the plasma concentration ranging from 0 to 50 ng/mL.*
trospium-chloride-20mg - trospium chloride 20mg

Exelan Trospium Chloride Tablets, USP 20mg is a prescription medication used to treat overactive bladder symptoms such as urinary incontinence, urgency, and frequency. Each package contains 60 film-coated tablets that should be stored at 20°to 25° 68° to 77°F. Patients must follow the instructions on the Patient Information Leaflet provided separately by the pharmacist. Exelan Trospium Chloride Tablets should be kept in a tight container and away from children. It is manufactured by InvaGen Pharmaceuticals, a subsidiary of Cipla Ltd, and distributed by Exelan Pharmaceuticals, Inc. in Boca Raton, FL. For complete prescribing information, read the package insert.*
figure2 - trospium fig2

Figure 2 shows the Mean Change from Baseline in Urinary Frequency/24 Hours, by Visit for Study 1. The data includes a placebo group of 256 participants and a Trospium Chloride group of 253 participants. The week of treatment is displayed along the bottom axis, with the y-axis indicating the mean change in urinary frequency. Statistical significance is denoted by p-values displayed above the bars.*
figure3 - trospium fig3

The text describes a figure titled "Figure 3," which shows the mean change from baseline in urge incontinence per week in Study 1. The figure compares results between a placebo group and a group taking Trospium Chloride (N=253). The figure shows the mean (+SE) change at different weeks of treatment. There is a significant decrease in urge incontinence in the Trospium Chloride group at week 16 (p=0.003) and week 48 (p=0.012).*
fig4 - trospium fig4

This is a figure showing the change from baseline in urinary frequency per 24 hours for Study 2. The x-axis represents the week of treatment, while the y-axis shows the mean change with standard error bars. The study included 326 participants on placebo and 323 participants on Sanctura®. There is no additional information available.*
figure5 - trospium fig5

The graph in Figure 5 shows the mean change from baseline in urge incontinence per week over the course of treatment for Study 2. The study includes a placebo group with 325 participants and a group receiving Sanctura with 323 participants. It appears that there is a significant mean improvement in urge incontinence for the Sanctura group compared to the placebo group starting around week 2 of treatment.*
* The product label images have been analyzed using a combination of traditional computing and machine learning techniques. It should be noted that the descriptions provided may not be entirely accurate as they are experimental in nature. Use the information in this page at your own discretion and risk.