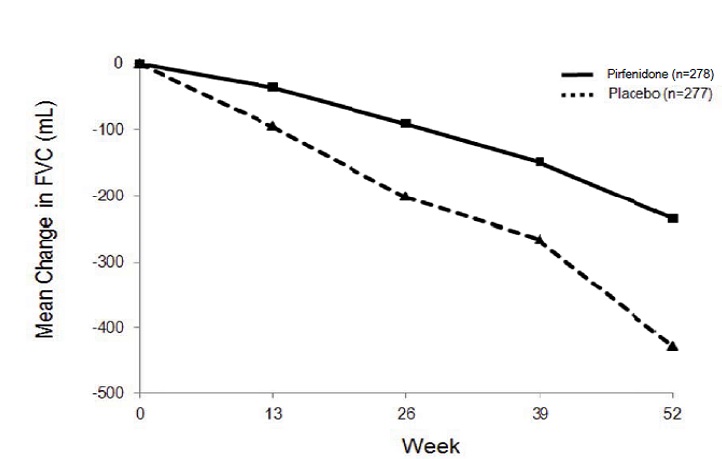
Figure 1 (Pirfenidone Figure1)
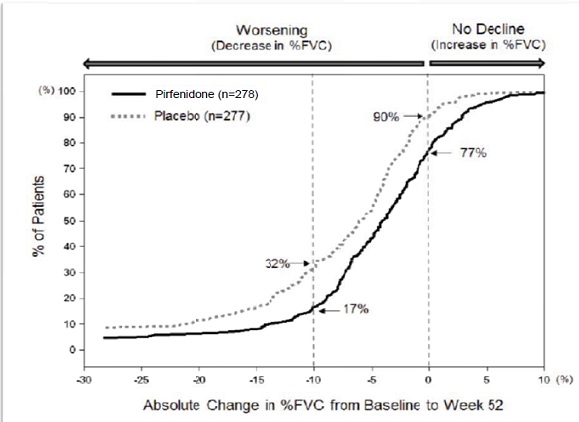
This is a table that compares the absolute change in %FVC (Forced Vital Capacity) from baseline to week 52 between two groups of patients: those who received Pifenidone and those who received a placebo. The percentage of patients who experienced worsening or improvement of %FVC are shown as well. No further information beyond what is presented in the table is available.*