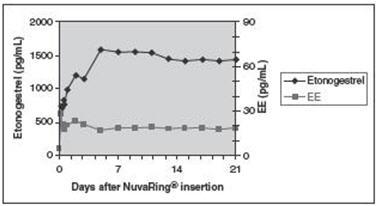
Figure 1 (Nuvaring 01)
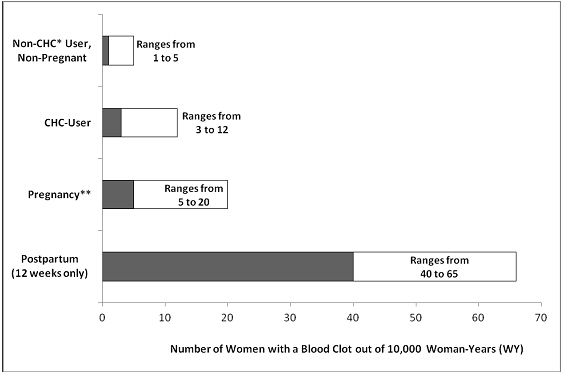
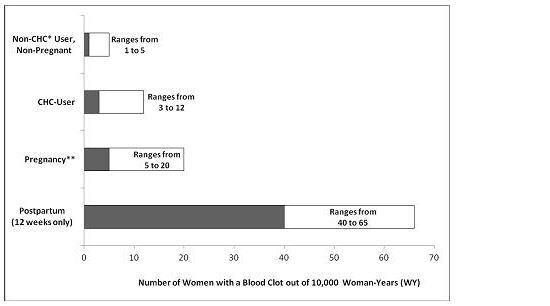
This appears to be a chart displaying the risk of blood clots in women based on various factors such as pregnancy, postpartum, and being a user of CHC (combination hormonal contraception). The chart includes numerical ranges for each category and the number of women with a blood clot out of 10,000 Woman-Years (WY).*