Product Images Gabapentin

View Photos of Packaging, Labels & Appearance

Product Label Images

The following 8 images provide visual information about the product associated with Gabapentin NDC 76420-047 by Asclemed Usa, Inc., such as packaging, labeling, and the appearance of the drug itself. This resource could be helpful for medical professionals, pharmacists, and patients seeking to verify medication information and ensure they have the correct product.

gabapentin-300mg-cap.jpg - gabapentin 300mg cap

gabapentin-300mg-cap.jpg - gabapentin 300mg cap

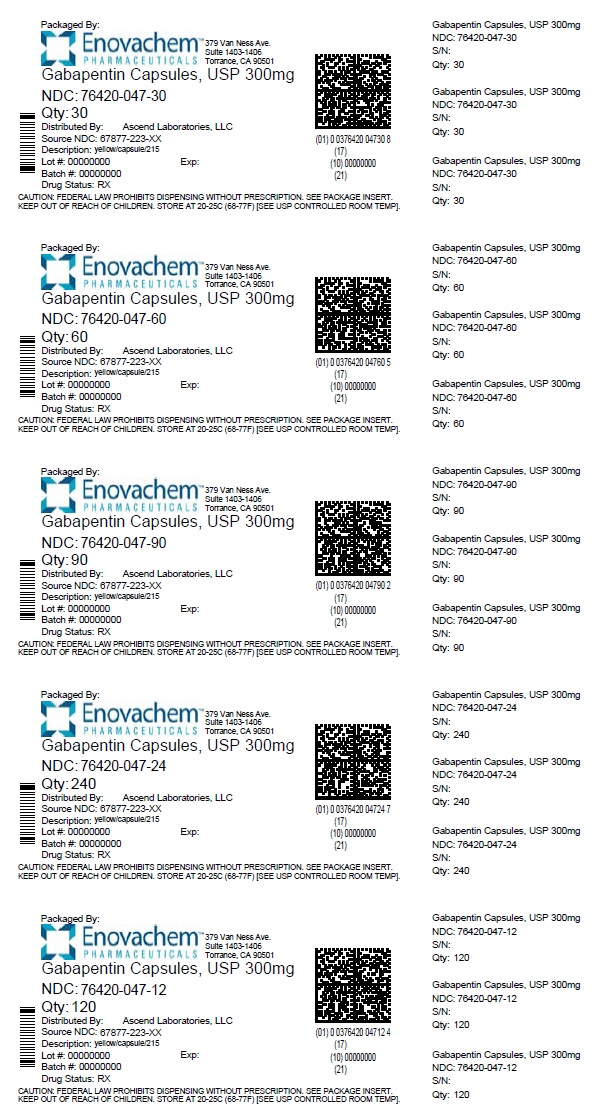
This text appears to be listing Gabapentin Capsules, USP 300mg of different quantities and NDC codes. The capsules are distributed by Ascent Laboratories, LLC and have different lot numbers and drug stats (RX). There are also some codes that seem to correspond to storage and control of these capsules.*

gabapentin 400mg cap

gabapentin 400mg cap

This is a list of different packages of Gabapentin Capsules, USP 400mg that vary in the number of capsules they contain and their NDC codes, among other information regarding the manufacturer, lot numbers, and expiry dates of the capsules.*

gabapentin-equation - gabapentin equation

gabapentin-equation - gabapentin equation

gabapentin fig1

gabapentin fig1

The text describes a chart or graph that shows the mean pain score for a study with a 4-week dose titration period and a 4-week fixed dose period. There is a comparison between a placebo group and a group taking Gabapentin at a dose of 3600 mg/day. The chart uses symbols to represent the results for each group over time. The baseline is also mentioned.*

gabapentin fig2

gabapentin fig2

The text is a table showing different pain scores for different doses of Gabapentin and a placebo over a period of weeks. It is not possible to generate a useful description as it lacks context and complete information.*

gabapentin fig3

gabapentin fig3

The text is describing a figure that shows the proportion of responders in controlled PHN studies, with various percentage ranges from 100% to 10%. The figure also includes data on different studies and medication dosages. There are some symbols and numbers that may belong to statistical analysis, but without context, it is not possible to determine their meaning.*

gabapentin-fig4 - gabapentin fig4

gabapentin-fig4 - gabapentin fig4

str fig05

str fig05

* The product label images have been analyzed using a combination of traditional computing and machine learning techniques. It should be noted that the descriptions provided may not be entirely accurate as they are experimental in nature. Use the information in this page at your own discretion and risk.