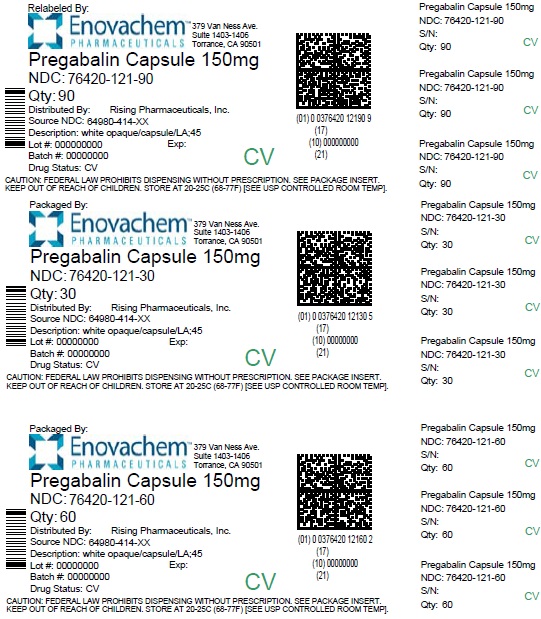
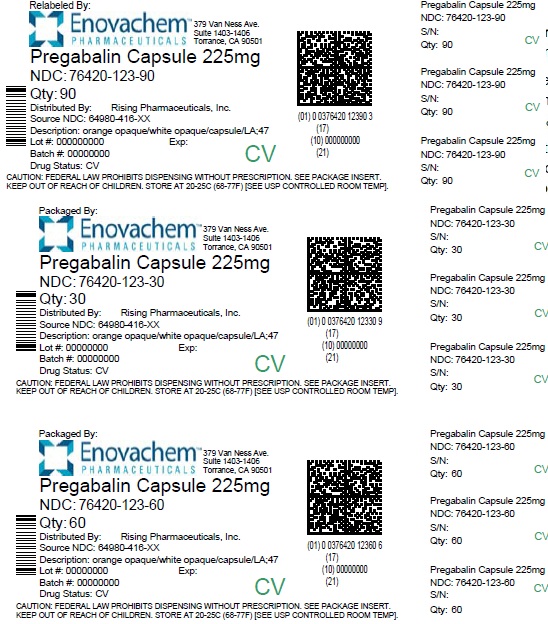
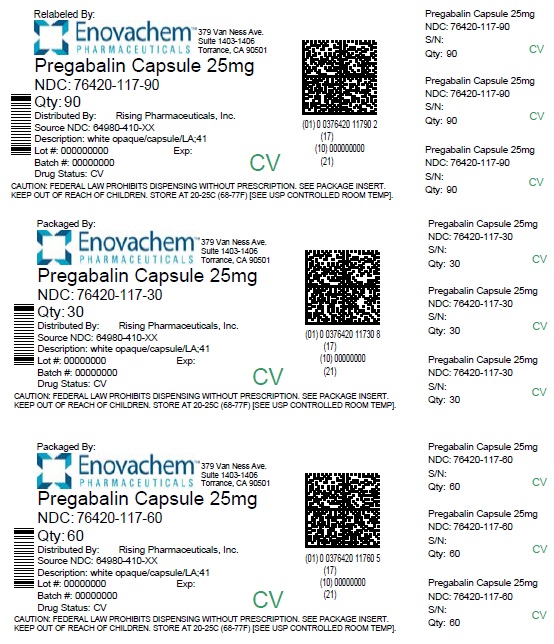
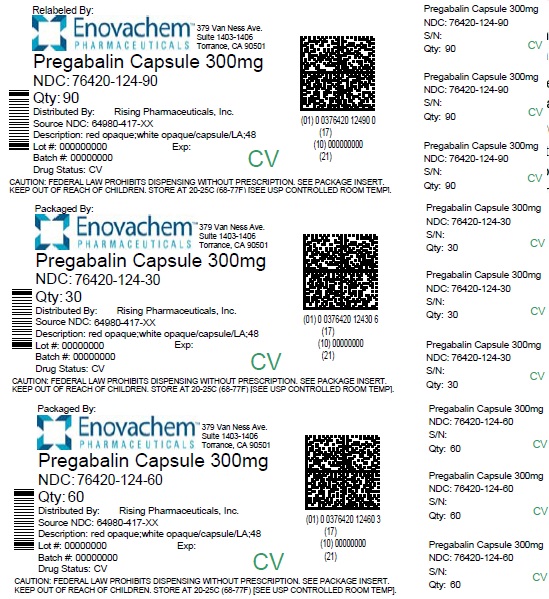
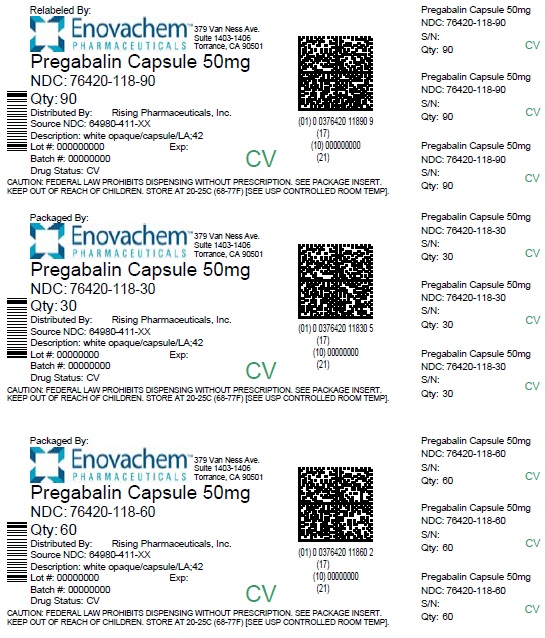
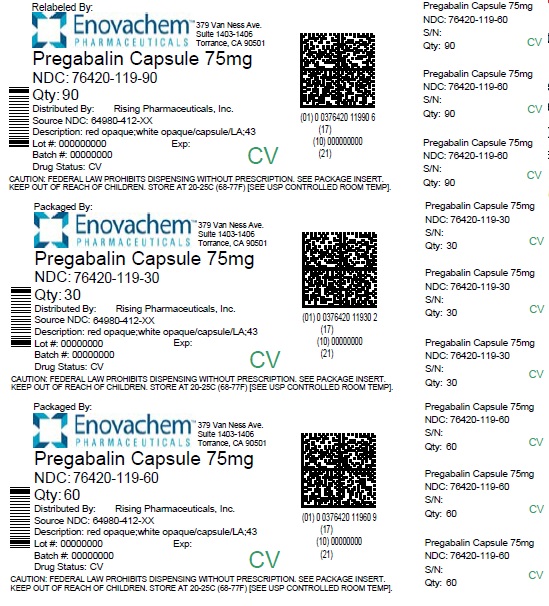
Pregabalin-100mg-1000-jpg (Pregabalin 100mg)

This is a set of label descriptions for different presentations of Pregabalin Capsules 100mg from Enovachem, a pharmaceutical company. The text includes the National Drug Code (NDC) and other details such as package quantity, Drug Status, and source number.*