Tadalafil Tablet
Product Images NDC 76420-546

View Photos of Packaging, Regulatory Labels, and Product Appearance

Product Visual Gallery

This gallery contains 20 technical images submitted to the FDA as part of the official labeling for Tadalafil (NDC 76420-546). Unlike standard consumer photos, these assets often include clinical data figures, molecular chemical structures, and official manufacturer packaging layouts.

As provided by Asclemed Usa, Inc., these visuals offer a comprehensive scientific overview of the product's physical and chemical identity, aiding pharmacists and researchers in product verification and study.

FDA Label Image

Structural Formula (Fig 01)
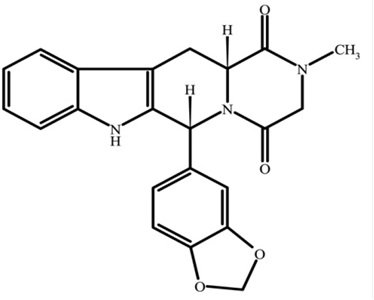
Structural Formula (Fig 01)
Chemical structure diagram of the active ingredient Tadalafil, showing its molecular framework and bonds in a black-and-white line drawing.*
FDA Label Image

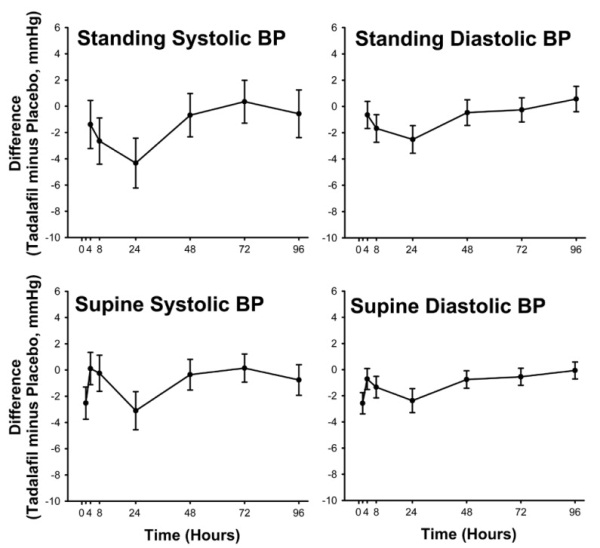
Figure 1 (Fig 02)

Figure 1 (Fig 02)
Four line graphs showing the difference in blood pressure readings (Tadalafil minus Placebo in mmHg) over time (hours) for standing systolic, standing diastolic, supine systolic, and supine diastolic blood pressure. Each graph displays data points with error bars across a 0 to 96-hour timeframe.*
FDA Label Image

Figure 2 (Fig 03)

Figure 2 (Fig 03)
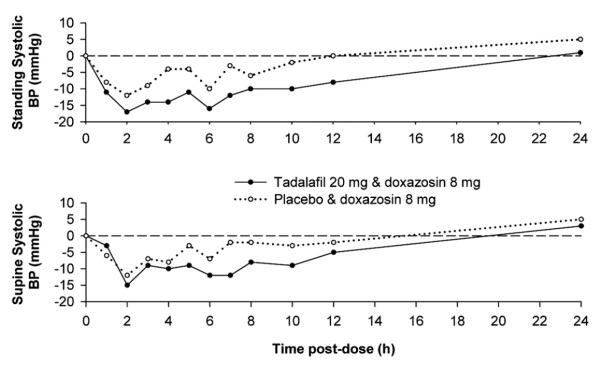
A two-panel line graph showing the effects of Tadalafil 20 mg with doxazosin 8 mg versus placebo with doxazosin 8 mg on systolic blood pressure (BP) over 24 hours post-dose. The top panel plots standing systolic BP changes in mmHg, and the bottom panel shows supine systolic BP changes, both relative to baseline, with time in hours on the x-axis.*
FDA Label Image

Figure 3 (Fig 04)

Figure 3 (Fig 04)
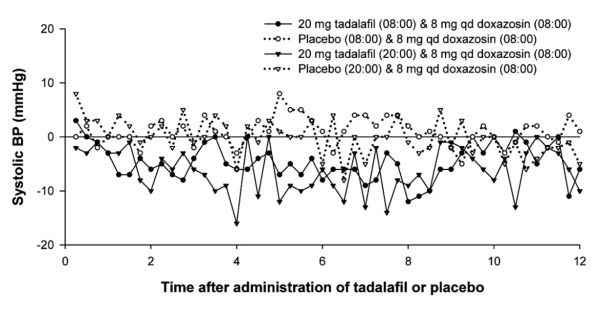
A line graph showing the effect on systolic blood pressure (mmHg) over 12 hours after administration of tadalafil or placebo, each combined with 8 mg qd doxazosin. Four lines represent 20 mg tadalafil given at 08:00 or 20:00 and corresponding placebo groups, indicating fluctuations in systolic BP over time.*
FDA Label Image

Figure 4 (Fig 05)

Figure 4 (Fig 05)
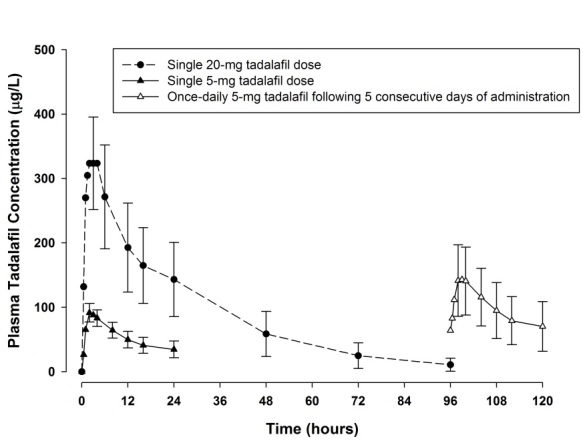
A pharmacokinetic graph showing plasma tadalafil concentration (µg/L) over time (hours) for three dosing regimens: single 20-mg dose, single 5-mg dose, and once-daily 5-mg dose following 5 consecutive days of administration. The graph displays concentration curves with error bars depicting variability at each time point.*
FDA Label Image

Image (Fig 06)

Image (Fig 06)
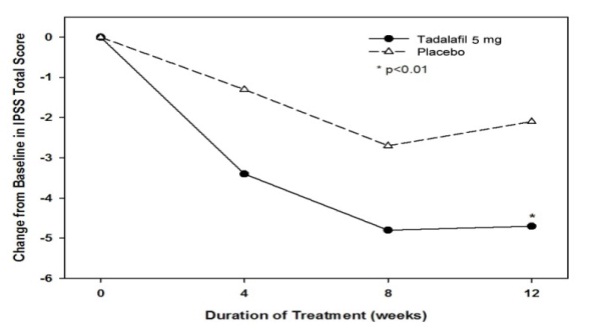
A line chart showing the change from baseline in IPSS Total Score over 12 weeks of treatment comparing Tadalafil 5 mg tablets and placebo. The x-axis represents treatment duration in weeks, and the y-axis shows the change in score. Tadalafil demonstrates a greater reduction in IPSS score compared to placebo, with statistical significance indicated at 12 weeks (p<0.01).*
FDA Label Image

Image (Fig 07)

Image (Fig 07)
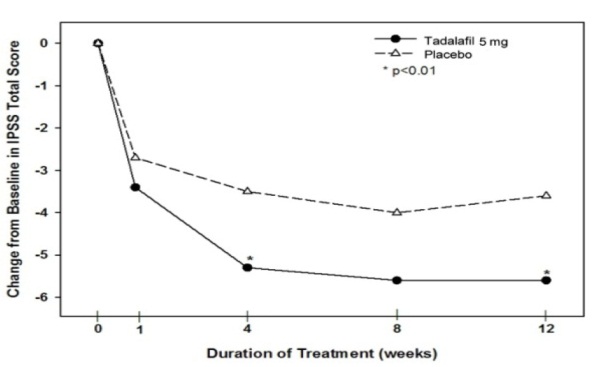
A line graph showing the change from baseline in IPSS total score over 12 weeks of treatment comparing Tadalafil 5 mg and placebo. The x-axis represents duration of treatment in weeks (0, 1, 4, 8, 12), and the y-axis shows change in IPSS total score from baseline, with Tadalafil demonstrating a greater reduction than placebo over time. Statistical significance is indicated at some points (p<0.01).*
FDA Label Image

Image (Fig 08)

Image (Fig 08)
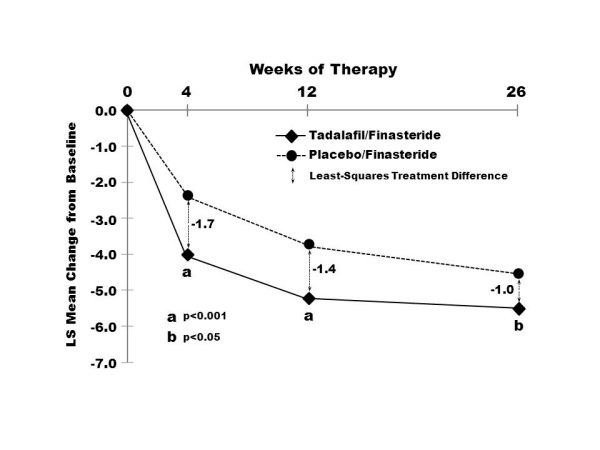
A line graph depicting the least-squares (LS) mean change from baseline over weeks of therapy for Tadalafil/Finasteride versus Placebo/Finasteride groups. The x-axis represents weeks of therapy (0, 4, 12, 26), and the y-axis shows LS mean change from baseline values ranging from 0 to -7. Data points indicate greater reduction for Tadalafil/Finasteride throughout the study, with statistical significance annotations at various time points.*
FDA Label Image

Figure 8 (Fig 09)

Figure 8 (Fig 09)
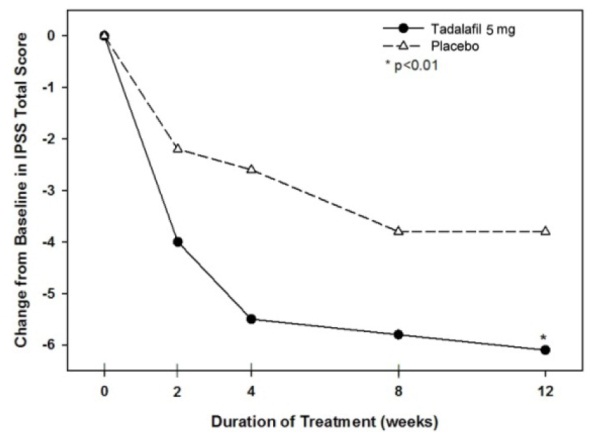
A line graph comparing change from baseline in IPSS total score over 12 weeks of treatment between Tadalafil 5 mg and placebo groups. The x-axis represents treatment duration in weeks, and the y-axis shows change in score. The Tadalafil group shows a greater decrease in IPSS score compared to placebo, with statistically significant difference at 12 weeks (p<0.01).*
FDA Label Image

Label (Fig 10)

Label (Fig 10)
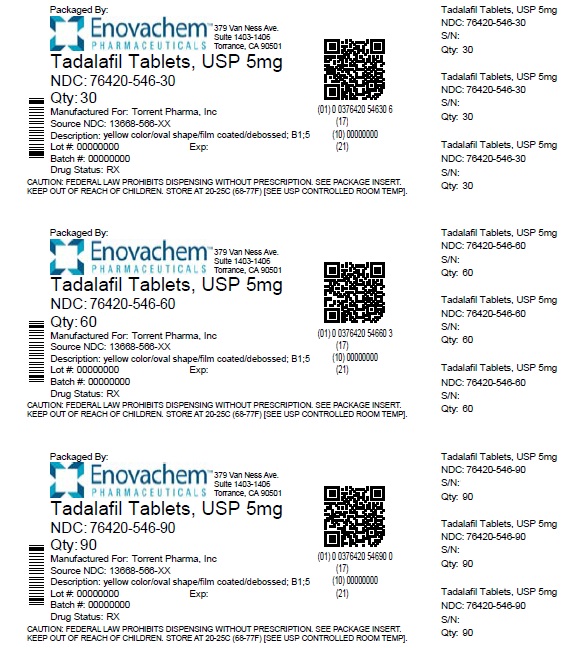
Packaging labels for Tadalafil Tablets USP 5 mg oral tablets by Enovachem Pharmaceuticals. Each label shows different package sizes: 30, 60, and 90 tablets. The label includes manufacturer information, NDC codes (76420-546-30, 76420-546-60, 76420-546-90), barcode, and regulatory caution statements about prescribing and storage.*
FDA Label Image

11 (Table 11)

11 (Table 11)
A data table titled "Mean Endpoint and Change from Baseline for the Primary Efficacy Variables in the Two Primary US Trials" comparing Placebo and Tadalafil Tablets 20 mg across two studies (Study A and Study B). The table presents values for EF Domain Score, Insertion of Penis (SEP2), and Maintenance of Erection (SEP3), including endpoints and changes from baseline, with associated p-values indicating statistical significance.*
FDA Label Image

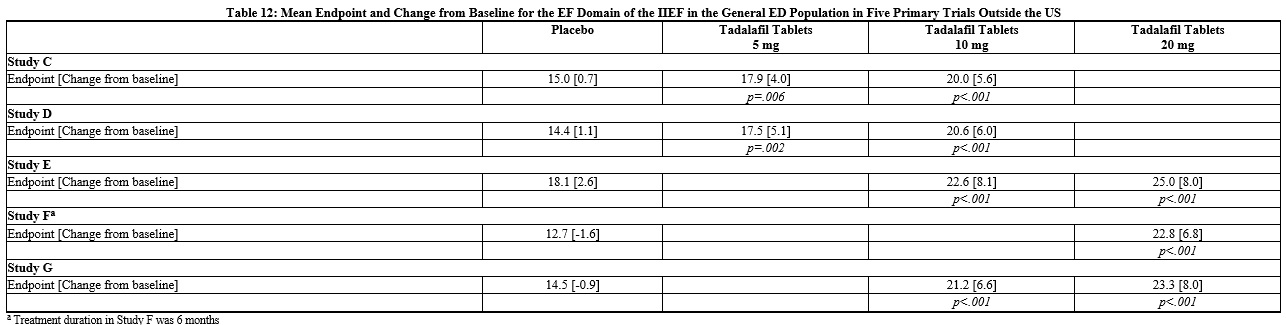
12 (Table 12)

12 (Table 12)
A data table titled 'Table 12' presenting mean endpoint and change from baseline for the EF domain of the IIEF in the general ED population across five primary trials outside the US. It compares placebo with Tadalafil tablets at 5 mg, 10 mg, and 20 mg doses across studies C, D, E, F, and G, showing numerical endpoint values and statistical significance where applicable.*
FDA Label Image

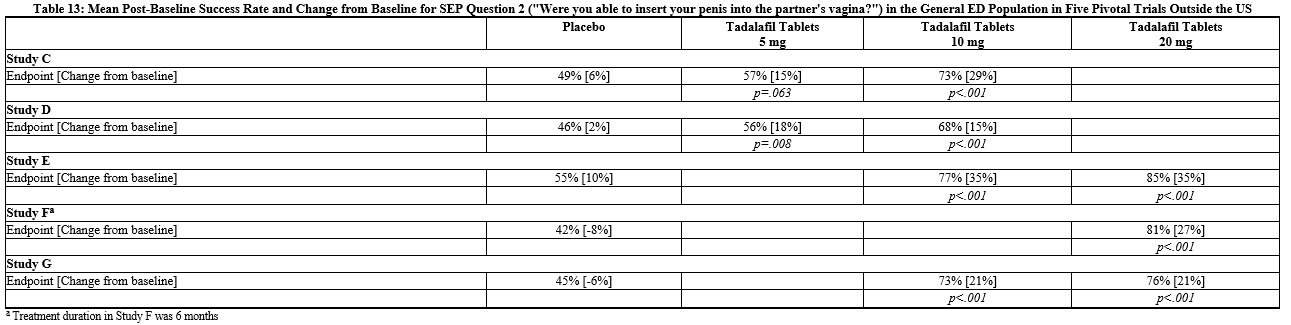
13 (Table 13)

13 (Table 13)
A data table showing mean post-baseline success rates and changes from baseline for the sexual encounter profile question 2 across five pivotal studies outside the US. It compares placebo and Tadalafil tablets at 5 mg, 10 mg, and 20 mg doses, presenting percentages of success rates and changes from baseline for each study group.*
FDA Label Image

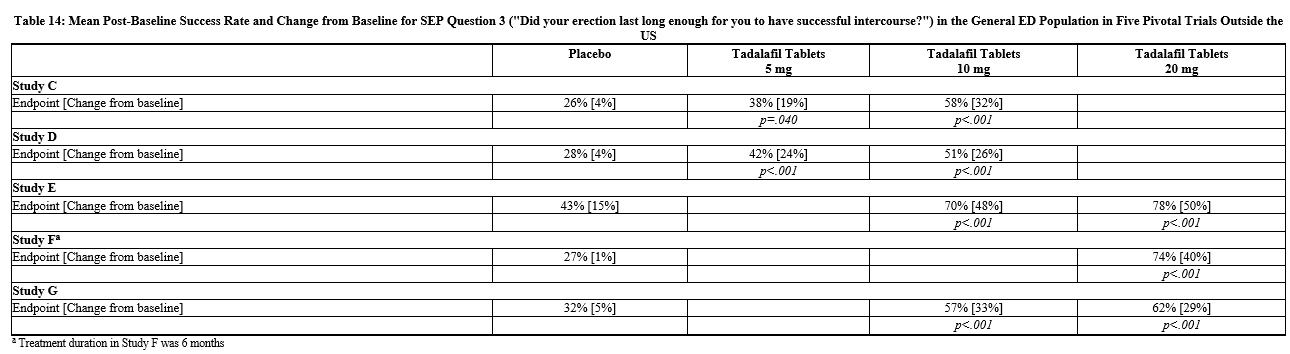
14 (Table 14)

14 (Table 14)
Data table presenting the mean post-baseline success rate and change from baseline for SEP Question 3 related to erection duration across five pivot trials involving placebo and Tadalafil tablets in 5 mg, 10 mg, and 20 mg doses, with individual study results and statistical significance values shown.*
FDA Label Image

15 (Table 15)

15 (Table 15)
A data table titled 'Mean Endpoint and Change from Baseline for the Primary Efficacy Variables in a Study in ED Patients with Diabetes.' It compares placebo, Tadalafil Tablets 10 mg, and Tadalafil Tablets 20 mg across metrics: EF Domain Score, Insertion of Penis (SEP2), and Maintenance of Erection (SEP3), with statistical significance (p-value < .001) shown for each.*
FDA Label Image

16 (Table 16)

16 (Table 16)
A table titled 'Mean Endpoint and Change from Baseline for the Primary Efficacy Variables in a Study in Patients who Developed ED Following Bilateral Nerve-Sparing Radical Prostatectomy.' It compares placebo and Tadalafil 20 mg tablets groups on EF Domain Score, Insertion of Penis, and Maintenance of Erection, showing results for endpoint and change from baseline with associated p-values indicating statistical significance.*
FDA Label Image

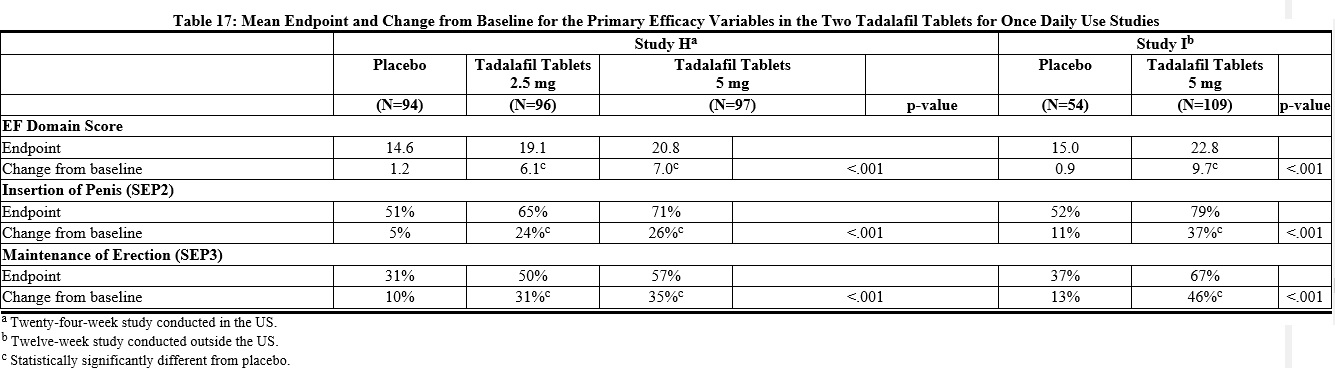
17 (Table 17)

17 (Table 17)
A data table titled Table 17 showing mean endpoint and change from baseline for primary efficacy variables in two tadalafil tablet once-daily use studies. The table compares placebo, tadalafil 2.5 mg, and tadalafil 5 mg across Study Ha (U.S. 24-week) and Study Ib (12-week outside U.S.), detailing EF Domain Score, Insertion of Penis (SEP2), and Maintenance of Erection (SEP3) with endpoints, changes from baseline, and statistical significance (p-values).*
FDA Label Image

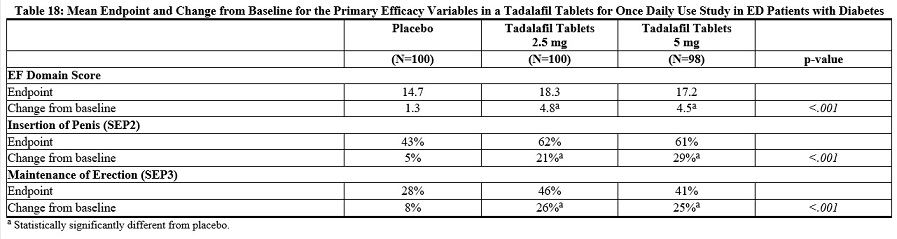
18 (Table 18)

18 (Table 18)
Table presenting mean endpoint and change from baseline for primary efficacy variables in a Tadalafil tablet study for once-daily use in ED patients with diabetes. Data compares placebo, Tadalafil 2.5 mg, and Tadalafil 5 mg groups across EF domain score, insertion of penis, and maintenance of erection, including sample sizes and p-values.*
FDA Label Image

19 (Table 19)

19 (Table 19)
A data table titled 'Mean IPSS Changes in BPH Patients in Two Tadalafil Tablets for Once Daily Use Studies' comparing Placebo and Tadalafil Tablets 5 mg across two studies (Study J and Study K). It shows total symptom score (IPSS) at baseline and changes from baseline to week 12, with p-values indicating statistical significance.*
FDA Label Image

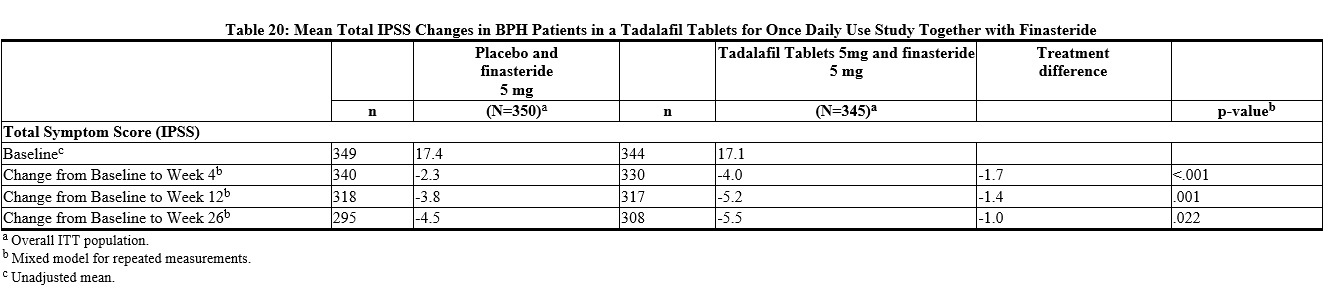
20 (Table 20)

20 (Table 20)
Table showing mean total IPSS changes in BPH patients in a study comparing placebo with finasteride 5 mg versus Tadalafil Tablets 5 mg plus finasteride 5 mg. It includes baseline scores and changes from baseline to weeks 4, 12, and 26, with treatment differences and p-values.*

* About these descriptions: Image descriptions on this page are generated by automated AI analysis of the product label images from the manufacturer's FDA label submission (SPL). They are provided for reference only and may contain errors or omissions. Always rely on the printed label itself and the official FDA labeling, and consult a pharmacist or healthcare professional with any questions about this product.