Sildenafil Citrate Tablet, Film Coated
Product Images NDC 76420-565

View Photos of Packaging, Regulatory Labels, and Product Appearance

Product Visual Gallery

This gallery contains 12 technical images submitted to the FDA as part of the official labeling for Sildenafil Citrate (NDC 76420-565). Unlike standard consumer photos, these assets often include clinical data figures, molecular chemical structures, and official manufacturer packaging layouts.

As provided by Asclemed Usa, Inc., these visuals offer a comprehensive scientific overview of the product's physical and chemical identity, aiding pharmacists and researchers in product verification and study.

FDA Label Image

Sildenafil_fig1.jpg (Sildenafil Fig1)

Sildenafil_fig1.jpg (Sildenafil Fig1)
Line graph depicting the mean change from baseline in sitting systolic blood pressure over 24 hours in healthy volunteers, comparing Sildenafil 100 mg with placebo. The x-axis shows time post dose in hours, and the y-axis displays systolic blood pressure changes in mmHg.*
FDA Label Image

Sildenafil_fig3 (Sildenafil Fig 3)

Sildenafil_fig3 (Sildenafil Fig 3)
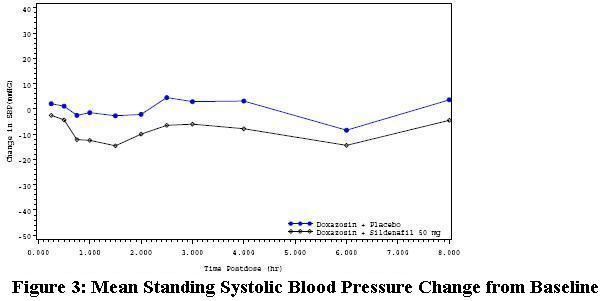
A line graph titled 'Mean Standing Systolic Blood Pressure Change from Baseline' showing changes in mmHg over time in hours post-dose for two groups: Doxazosin + Placebo and Doxazosin + Sildenafil 50 mg. The graph compares blood pressure changes between the two treatments across an 8-hour period.*
FDA Label Image

Sildenafil_fig_4 (Sildenafil Fig 4)

Sildenafil_fig_4 (Sildenafil Fig 4)
A line graph depicting mean standing systolic blood pressure changes from baseline over an 8-hour period. The graph compares two groups: one receiving Doxazosin plus Sildenafil 100 mg and the other receiving Doxazosin plus Placebo, illustrating blood pressure variations measured in mmHg at hourly intervals post dosing.*
FDA Label Image

Sidenafil_fig_5 (Sildenafil Fig 5)

Sidenafil_fig_5 (Sildenafil Fig 5)
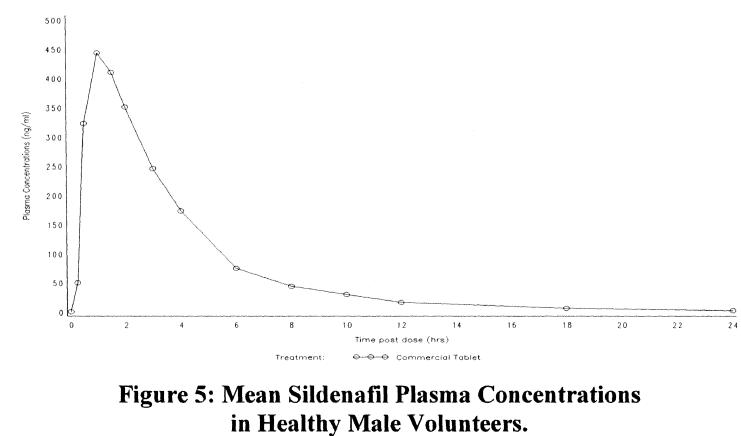
A line graph titled 'Mean Sildenafil Plasma Concentrations in Healthy Male Volunteers,' showing plasma concentration (ng/ml) on the y-axis and time post dose (hours) on the x-axis. The graph illustrates plasma levels of sildenafil over 24 hours after administration of a commercial tablet, peaking within the first two hours and declining gradually thereafter.*
FDA Label Image

100mg (Sildenafil 100mg)

100mg (Sildenafil 100mg)
Labels for Sildenafil Tablets USP 100 mg film-coated oral tablets packaged by Enovachem Pharmaceuticals and marketed by Ajanta Pharma USA Inc. The labels show four different package sizes: 30, 60, 90, and 100 count. Each label includes NDC codes, packaging and marketing details, dosage form description, and storage instructions. The tablets are described as green/oval shaped, film-coated, and debossed.*
FDA Label Image

25mg (Sildenafil 25mg)

25mg (Sildenafil 25mg)
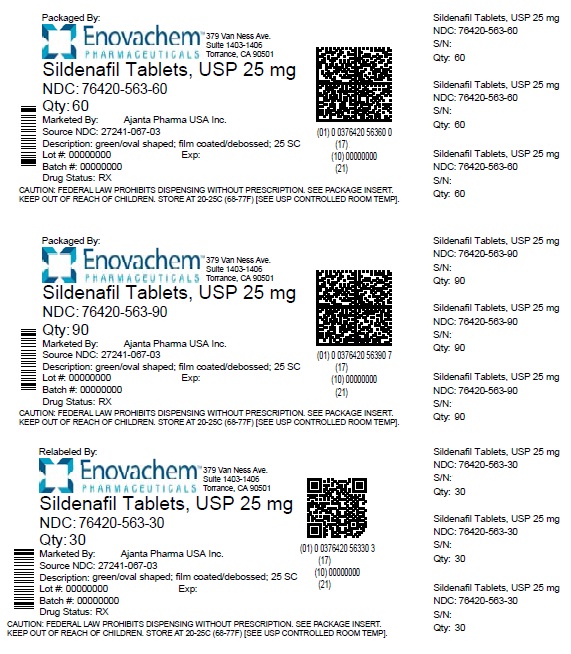
Three pharmaceutical label images for Sildenafil Tablets USP 25 mg by Enovachem Pharmaceuticals. Each label shows different quantities: 60 tablets, 90 tablets, and 30 tablets in film-coated, green/oval-shaped tablets. Marked by Ajanta Pharma USA Inc, with storage instructions and caution statements included. Each label also features a QR code and NDC 76420-563-30.*
FDA Label Image

50mg (Sildenafil 50mg)

50mg (Sildenafil 50mg)
Labels for Sildenafil Tablets USP 50 mg, film coated oval green tablets, packaged in quantities of 30, 60, 90, and 100 units. Packaged and relabeled by Enovachem Pharmaceuticals, marketed by Ajanta Pharma USA Inc. Includes NDC numbers, lot, batch, and storage information with QR codes on each label.*
FDA Label Image

Sildenafil-fig7 (Sildenafil Fig7)

Sildenafil-fig7 (Sildenafil Fig7)
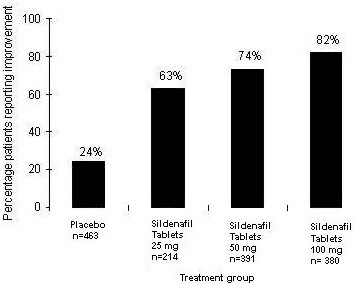
A bar chart showing the percentage of patients reporting improvement across different treatments: placebo, Sildenafil 25 mg, Sildenafil 50 mg, and Sildenafil 100 mg tablets. The percentages increase with dosage, illustrating greater reported improvement with higher strengths.*
FDA Label Image

Str (Sildenafil Structure)

Str (Sildenafil Structure)
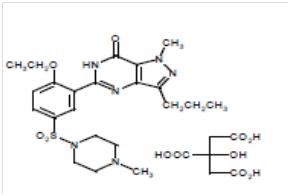
Chemical structure of Sildenafil shown as a molecular diagram, depicting the arrangement of atoms and bonds within the compound.*
FDA Label Image

Figure2 (Sildenafil Fig2)

Figure2 (Sildenafil Fig2)
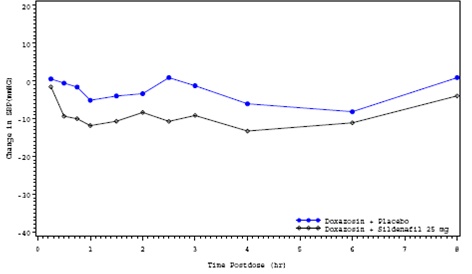
A line graph showing the change in a variable labeled as EDP (mmHg) over time in hours after dosing. The graph compares two groups: Doxazosin with Placebo and Doxazosin with Sildenafil 25 mg. The x-axis represents time post-dose in hours (0 to 8), and the y-axis represents the change in EDP ranging approximately from -40 to 20.*
FDA Label Image

Sildenafil_fig6b (Sildenafil Fig6b)

Sildenafil_fig6b (Sildenafil Fig6b)
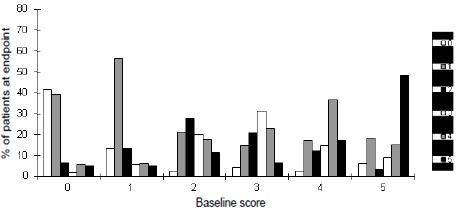
A bar chart showing the percentage of patients at endpoint categorized by baseline score values from 0 to 5. Different shaded bars represent distinct patient groups or categories, with a legend displayed on the right side describing each group.*
FDA Label Image

Sildenafil_fig6a (Sildenafil Figure6a)

Sildenafil_fig6a (Sildenafil Figure6a)
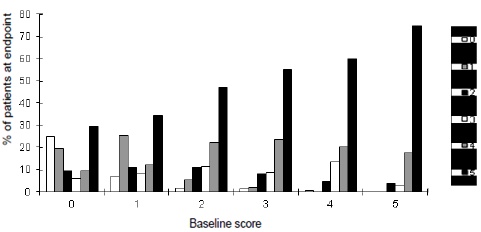
A bar chart depicting the percentage of patients at endpoint relative to baseline scores. The x-axis represents baseline scores from 0 to 5, while the y-axis shows the percentage of patients at endpoint, ranging from 0% to 80%. Multiple bars at each baseline score indicate different data groups, with a legend on the right side identifying the groups by black, dark gray, medium gray, light gray, and white bars.*

* About these descriptions: Image descriptions on this page are generated by automated AI analysis of the product label images from the manufacturer's FDA label submission (SPL). They are provided for reference only and may contain errors or omissions. Always rely on the printed label itself and the official FDA labeling, and consult a pharmacist or healthcare professional with any questions about this product.