Tramadol Hydrochloride
Product Images NDC 76519-1009

View Photos of Packaging, Regulatory Labels, and Product Appearance

Product Visual Gallery

This gallery contains 4 technical images submitted to the FDA as part of the official labeling for Tramadol Hydrochloride (NDC 76519-1009). Unlike standard consumer photos, these assets often include clinical data figures, molecular chemical structures, and official manufacturer packaging layouts.

As provided by H.j. Harkins Company, Inc., these visuals offer a comprehensive scientific overview of the product's physical and chemical identity, aiding pharmacists and researchers in product verification and study.

FDA Label Image

Tramadol500caps (Tramadol500caps)
Tramadol500caps (Tramadol500caps)
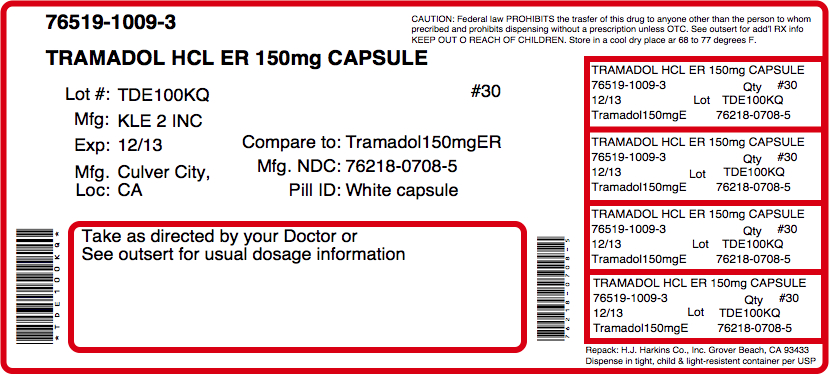
Label for Tramadol Hydrochloride Extended Release 150 mg capsules. The label includes lot number TDE100KQ, manufacturer KLE 2 INC located in Culver City, CA, and expiration date 12/13. It references comparison to Tramadol 150 mg ER with NDC 76218-0708-5. The label instructs to take as directed by your doctor and includes quantity 30 capsules. The labeler is H.J. Harkins Company, Inc.*
FDA Label Image

Structural Formula (Con07 0000 01)

Structural Formula (Con07 0000 01)
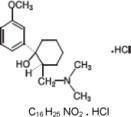
Chemical structure of Tramadol Hydrochloride with molecular formula C16H25NO2·HCl, showing the arrangement of carbon, hydrogen, nitrogen, oxygen atoms, and the hydrochloride salt component.*
FDA Label Image

Figure 2 (Con07 0000 02)

Figure 2 (Con07 0000 02)
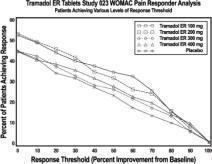
A line graph titled 'Tramadol ER Tablets Study 023 WOMAC Pain Responder Analysis' showing the percent of patients achieving various levels of pain response threshold (percent improvement from baseline) on the x-axis. The y-axis represents the percent of patients achieving these thresholds. The graph compares Tramadol ER 100 mg, 200 mg, 300 mg, 400 mg, and placebo, with multiple downward sloping lines indicating the response rates for each treatment group.*
FDA Label Image

Figure 3 (Con07 0000 03)

Figure 3 (Con07 0000 03)
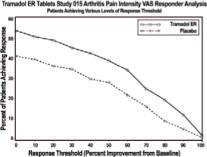
A line chart titled 'Tramadol ER Tablets Study 015 Arthritis Pain Intensity VAS Responder Analysis.' It shows the relationship between response threshold (percent improvement from baseline) on the x-axis and the percent of patients achieving that threshold on the y-axis, comparing Tramadol ER and placebo treatments.*

* About these descriptions: Image descriptions on this page are generated by automated AI analysis of the product label images from the manufacturer's FDA label submission (SPL). They are provided for reference only and may contain errors or omissions. Always rely on the printed label itself and the official FDA labeling, and consult a pharmacist or healthcare professional with any questions about this product.